Jump to content

Carmzow-Wallmow

Coordinates: 53°22′0″N 14°04′0″E / 53.36667°N 14.06667°E / 53.36667; 14.06667
From Wikipedia, the free encyclopedia

This is an old revision of this page, as edited by Hans G. Oberlack (talk | contribs) at 21:18, 8 October 2018 (→‎Demography: Latest data added). The present address (URL) is a permanent link to this revision, which may differ significantly from the current revision.

Carmzow-Wallmow
Location of Carmzow-Wallmow within Uckermark district
AngermündeBoitzenburger LandBrüssowCarmzow-WallmowCasekowFlieth-StegelitzGartzGerswaldeGöritzGramzowGrünowHohenselchow-Groß PinnowLychenMescherinMilmersdorfMittenwaldeNordwestuckermarkOberuckerseePinnowPrenzlauRandowtalSchenkenbergSchönfeldSchwedtTantowTemmen-RingenwaldeTemplinUckerfeldeUckerlandZichowBrandenburg
Carmzow-Wallmow is located in Germany
Carmzow-Wallmow
Carmzow-Wallmow
Carmzow-Wallmow is located in Brandenburg
Carmzow-Wallmow
Carmzow-Wallmow
Coordinates: 53°22′0″N 14°04′0″E / 53.36667°N 14.06667°E / 53.36667; 14.06667
CountryGermany
StateBrandenburg
DistrictUckermark
Municipal assoc.Brüssow (Uckermark)
Government
 • MayorBernd Loehr
Area
 • Total31.86 km2 (12.30 sq mi)
Elevation
62 m (203 ft)
Population
 (2022-12-31)[1]
 • Total596
 • Density19/km2 (48/sq mi)
Time zoneUTC+01:00 (CET)
 • Summer (DST)UTC+02:00 (CEST)
Postal codes
17291
Dialling codes039862
Vehicle registrationUM
Websitewww.amt-bruessow.de

Carmzow-Wallmow is a municipality in the Uckermark district, in Brandenburg, Germany.
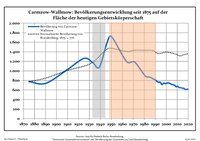
Demography

Development of Population since 1875 within the Current Boundaries (Blue Line: Population; Dotted Line: Comparison to Population Development of Brandenburg state; Grey Background: Time of Nazi rule; Red Background: Time of Communist rule)
Carmzow-Wallmow: Population development
within the current boundaries (2017)[2]
YearPop.±% p.a.
1875 776—    
1890 738−0.33%
1910 1,029+1.68%
1925 1,262+1.37%
1933 1,174−0.90%
1939 1,079−1.40%
1946 1,590+5.69%
1950 1,719+1.97%
1964 1,191−2.59%
1971 1,188−0.04%
1981 891−2.84%
1985 870−0.59%
1989 821−1.44%
1990 814−0.85%
YearPop.±% p.a.
1991 789−3.07%
1992 773−2.03%
1993 761−1.55%
1994 766+0.66%
1995 748−2.35%
1996 714−4.55%
1997 729+2.10%
1998 743+1.92%
1999 734−1.21%
2000 736+0.27%
2001 747+1.49%
2002 747+0.00%
2003 741−0.80%
2004 729−1.62%
YearPop.±% p.a.
2005 715−1.92%
2006 713−0.28%
2007 702−1.54%
2008 692−1.42%
2009 668−3.47%
2010 678+1.50%
2011 662−2.36%
2012 650−1.81%
2013 648−0.31%
2014 643−0.77%
2015 634−1.40%
2016 636+0.32%
2017 614−3.46%

References

  1. ^ "Bevölkerungsentwicklung und Bevölkerungsstandim Land Brandenburg Dezember 2022" (PDF). Amt für Statistik Berlin-Brandenburg (in German). June 2023.
  2. ^ Detailed data sources are to be found in the Wikimedia Commons.Population Projection Brandenburg at Wikimedia Commons