
List of Irish counties by population
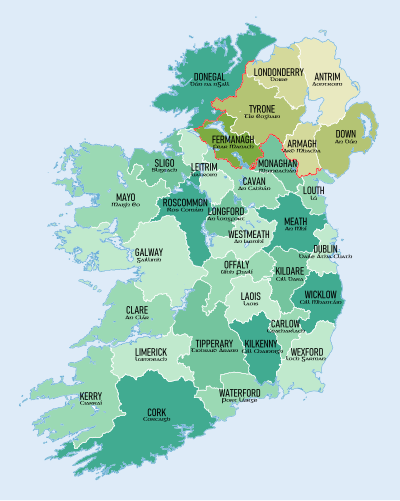
This is a list of counties of Ireland ordered by population. Counties in the Republic of Ireland are shown in normal type, while those in Northern Ireland are listed in italic type. Non-traditional administrative counties are indicated by a cream-coloured background.
For a more detailed analysis of current and historical Irish populations in the Republic of Ireland, see Irish population analysis. The population of the six counties of Northern Ireland as of 2004 is 1,710,300 which would mean a total population on the island of Ireland as of 2006 of approximately 5,952,761.
Data source/age (as-of November 2012):
- Taken from latest Census Data for Northern Ireland[failed verification] and the Republic of Ireland.[1]
- Population data for all counties is based on census 2011.
- Density: Based on census 2011[2]
| Rank | County | Population | Density (/ km²) | Province | Change since previous census |
|---|---|---|---|---|---|
| 1 | Dublin | 1,273,069 | 1,380.8 | Leinster | |
| 2 | Antrim | 618,108 | 202.9 | Ulster | |
| 3 | Down | 531,665 | 215.6 | Ulster | |
| 4 | Cork | 519,032 | 69.0 | Munster | |
| - | Fingal | 273,991 | 600.6 | Leinster | |
| - | South Dublin | 265,205 | 1,190.6 | Leinster | |
| 5 | Galway | 250,541 | 40.7 | Connacht | |
| 6 | County Londonderry | 247,132 | 119.1 | Ulster | |
| 7 | Kildare | 210,312 | 124.1 | Leinster | |
| - | Dún Laoghaire–Rathdown | 206,261 | 1,620.1 | Leinster | |
| 8 | Limerick | 191,809 | 69.4 | Munster | |
| 9 | Meath | 184,135 | 78.6 | Leinster | |
| 10 | Tyrone | 179,000 | 54.5 | Ulster | |
| 11 | Armagh | 174,792 | 131.8 | Ulster | |
| 12 | Donegal | 161,137 | 32.9 | Ulster | |
| 13 | Tipperary | 158,754 | 36.8 | Munster | |
| 14 | Kerry | 145,502 | 30.1 | Munster | |
| 15 | Wexford | 145,320 | 61.2 | Leinster | |
| 16 | Wicklow | 136,640 | 67.4 | Leinster | |
| 17 | Mayo | 130,638 | 23.3 | Connacht | |
| 18 | Louth | 122,897 | 148.7 | Leinster | |
| 19 | Clare | 117,196 | 33.8 | Munster | |
| 20 | Waterford | 113,795 | 61.2 | Munster | |
| 21 | Kilkenny | 95,419 | 46.0 | Leinster | |
| 22 | Westmeath | 86,164 | 46.7 | Leinster | |
| 23 | Laois | 80,559 | 46.8 | Leinster | |
| 24 | Offaly | 76,687 | 38.3 | Leinster | |
| 25 | Cavan | 73,183 | 37.7 | Ulster | |
| 26 | Sligo | 65,393 | 35.5 | Connacht | |
| 27 | Roscommon | 64,065 | 25.0 | Connacht | |
| 28 | Fermanagh | 61,170 | 36.1 | Ulster | |
| 29 | Monaghan | 60,483 | 46.7 | Ulster | |
| 30 | Carlow | 54,612 | 60.8 | Leinster | |
| 31 | Longford | 39,000 | 35.7 | Leinster | |
| 32 | Leitrim | 31,796 | 19.9 | Connacht | |
| Average | 199,974 | ||||
| Total | Ireland | 6,469,688 | 76.6 |
See also
Notes
- The populations of Dublin, Cork, Galway, Limerick and Waterford cities have been added to their respective traditional counties. For a list of these cities by population see, List of towns in the Republic of Ireland by population. For more information on city status, see City status in Ireland.