
Sunspot: Difference between revisions
m from NASA to NASA/ESA (SOHO) |
|||
| Line 8: | Line 8: | ||
Sunspots, being the manifestation of intense magnetic activity, host secondary phenomena such as [[coronal loop]]s and [[Magnetic Reconnection|reconnection]] events. Most [[solar flares]] and [[coronal mass ejections]] originate in magnetically active regions around visible sunspot groupings. Similar phenomena indirectly observed on [[star]]s are commonly called '''''starspots''''' and both light and dark spots have been measured.<ref name="strassmeier">[http://www.aip.de/groups/activity/presse/pressrelease990610.html press release 990610], K. G. Strassmeier, [[1999-06-10]], [[University of Vienna]], "starspots vary on the same (short) time scales as Sunspots do", "HD 12545 had a warm spot (350 K above photospheric temperature; the white area in the picture)"</ref> |
Sunspots, being the manifestation of intense magnetic activity, host secondary phenomena such as [[coronal loop]]s and [[Magnetic Reconnection|reconnection]] events. Most [[solar flares]] and [[coronal mass ejections]] originate in magnetically active regions around visible sunspot groupings. Similar phenomena indirectly observed on [[star]]s are commonly called '''''starspots''''' and both light and dark spots have been measured.<ref name="strassmeier">[http://www.aip.de/groups/activity/presse/pressrelease990610.html press release 990610], K. G. Strassmeier, [[1999-06-10]], [[University of Vienna]], "starspots vary on the same (short) time scales as Sunspots do", "HD 12545 had a warm spot (350 K above photospheric temperature; the white area in the picture)"</ref> |
||
== |
==Jayden is a SKUXX== |
||
{{main|Solar variation}} |
{{main|Solar variation}} |
||
{{FixHTML|beg}} |
{{FixHTML|beg}} |
||
Revision as of 06:33, 15 October 2008
A sunspot is a region on the Sun's surface (photosphere) that is marked by intense magnetic activity, which inhibits convection, forming areas of reduced surface temperature. They can be visible from Earth without the aid of a telescope. Although they are at temperatures of roughly 4,000–4,500 K, the contrast with the surrounding material at about 5,800 K leaves them clearly visible as dark spots, as the intensity of a heated black body (closely approximated by the photosphere) is a function of T (temperature) to the fourth power. If a sunspot were isolated from the surrounding photosphere it would be brighter than an electric arc.
A minimum in the eleven-year sunspot cycle happened during 2008.[1] While the reverse polarity sunspot[2] observed on 4 January 2008 may represent the start of Cycle 24, no additional sunspots have yet been seen in this cycle. The definition of a new sunspot cycle is when the average number of sunspots of the new cycle's magnetic polarity outnumbers that of the old cycle's polarity [citation needed]. Forecasts in 2006 predicted Cycle 24 to start between late 2007 and early 2008, but new estimates suggest a delay until 2009.
Sunspots, being the manifestation of intense magnetic activity, host secondary phenomena such as coronal loops and reconnection events. Most solar flares and coronal mass ejections originate in magnetically active regions around visible sunspot groupings. Similar phenomena indirectly observed on stars are commonly called starspots and both light and dark spots have been measured.[3]
Jayden is a SKUXX


Sunspot populations quickly rise and more slowly fall on an irregular cycle about every 11 years. Significant variations of the 11-year period are known over longer spans of time. For example, from 1900 to the 1960s the solar maxima trend of sunspot count has been upward; from the 1960s to the present, it has diminished somewhat.[4] The Sun is presently at a markedly heightened level of sunspot activity and was last similarly active over 8,000 years ago.[5]
The number of sunspots correlates with the intensity of solar radiation over the period (since 1979) when satellite measurements of absolute radiative flux were available. Since sunspots are darker than the surrounding photosphere it might be expected that more sunspots would lead to less solar radiation and a decreased solar constant. However, the surrounding margins of sunspots are hotter than the average, and so are brighter; overall, more sunspots increase the sun's solar constant or brightness. The variation caused by the sunspot cycle to solar output is relatively small, on the order of 0.1% of the solar constant (a peak-to-trough range of 1.3 W m-2 compared to 1,366 W m-2 for the average solar constant).[6][7] During the Maunder Minimum in the 17th Century there were hardly any sunspots at all. This coincides with a period of cooling known as the Little Ice Age.
It has been speculated that there may be a resonant gravitational link between a photospheric tidal force from the planets, the dominant component by summing gravitational tidal force (75% being Jupiter's) with an 11-year cycle.[8]
History
Apparent references to sunspots were made by Chinese astronomers in 28 BC (Hanshu, 27), who probably could see the largest spot groups when the sun's glare was filtered by wind-borne dust from the various central Asian deserts. A large sunspot was also seen at the time of Charlemagne's death in A.D. 813 and sunspot activity in 1129 was described by John of Worcester. However, these observations were misinterpreted until Galileo gave the correct explanation in 1612.
They were first observed telescopically in late 1610 by the English astronomer Thomas Harriot and Frisian astronomers Johannes and David Fabricius, who published a description in June 1611. At the latter time Galileo had been showing sunspots to astronomers in Rome, and Christoph Scheiner had probably been observing the spots for two or three months. The ensuing priority dispute between Galileo and Scheiner, neither of whom knew of the Fabricius' work, was thus as pointless as it was bitter.
Sunspots had some importance in the debate over the nature of the solar system. They showed that the Sun rotated, and their comings and goings showed that the Sun changed, contrary to the teaching of Aristotle. The details of their apparent motion could not be readily explained except in the heliocentric system of Copernicus.
The cyclic variation of the number of sunspots was first observed by Heinrich Schwabe between 1826 and 1843 and led Rudolf Wolf to make systematic observations starting in 1848. The Wolf number is an expression of individual spots and spot groupings, which has demonstrated success in its correlation to a number of solar observables. Also in 1848, Joseph Henry projected an image of the Sun onto a screen and determined that sunspots were cooler than the surrounding surface.[9]
Wolf also studied the historical record in an attempt to establish a database on cyclic variations of the past. He established a cycle database to only 1700, although the technology and techniques for careful solar observations were first available in 1610. Gustav Spörer later suggested a 70-year period before 1716 in which sunspots were rarely observed as the reason for Wolf's inability to extend the cycles into the seventeenth century. The economist William Stanley Jevons suggested that there is a relationship between sunspots and crises in business cycles. He reasoned that sunspots affect earth's weather, which, in turn, influences crop yields and, therefore, the economy.[10]
Edward Maunder would later suggest a period over which the Sun had changed modality from a period in which sunspots all but disappeared from the solar surface, followed by the appearance of sunspot cycles starting in 1700. Careful studies revealed the problem not to be a lack of observational data but included references to negative observations. Adding to this understanding of the absence of solar activity cycles were observations of aurorae, which were also absent at the same time. Even the lack of a solar corona during solar eclipses was noted prior to 1715.
Sunspot research was dormant for much of the 17th and early 18th centuries because of the Maunder Minimum, during which no sunspots were visible for some years; but after the resumption of sunspot activity, Heinrich Schwabe in 1843 reported a periodic change in the number of sunspots. Since 1991, the Royal Observatory of Belgium keeps track of sunspots as the World data center for the Sunspot Index.
Radio communications interference
Solar flares also create a wide spectrum of radio noise; at VHF (and under unusual conditions at HF) this noise may interfere directly with a wanted signal. The frequency with which a radio operator experiences solar flare effects will vary with the approximately 11-year sunspot cycle; more effects occur during solar maximum (when flare occurrence is high) than during solar minimum (when flare occurrence is very low). A radio operator can experience great difficulty in transmitting or receiving signals during solar flares due to more noise and different propagation patterns. However, sunspots can greatly increase the distances achieved on certain bands, and so are useful to radio amateurs. This is because the sunspots strengthens the ionosphere, and cause less radio waves to pass through and therefore increases propagation.
Significant events
An extremely powerful flare was emitted toward Earth on 1 September 1859. It interrupted electrical telegraph service and caused visible Aurora Borealis as far south as Havana, Hawaii, and Rome with similar activity in the southern hemisphere.
The most powerful flare observed by satellite instrumentation began on 4 November 2003 at 19:29 UTC, and saturated instruments for 11 minutes. Region 486 has been estimated to have produced an X-ray flux of X28. Holographic and visual observations indicate significant activity continued on the far side of the Sun.
In August 2008, a NOAA observatory reported only a half-sunspot, and another reported zero sunspots. The former had not happened in fifty years, and the latter in a hundred.[11]
Physics

Although the details of sunspot generation are still somewhat a matter of research, it is quite clear that sunspots are the visible counterparts of magnetic flux tubes in the convective zone of the sun that get "wound up" by differential rotation. If the stress on the flux tubes reaches a certain limit, they curl up quite like a rubber band and puncture the sun's surface. At the puncture points convection is inhibited, the energy flux from the sun's interior decreases, and with it the surface temperature.
The Wilson effect tells us that sunspots are actually depressions on the sun's surface. This model is supported by observations using the Zeeman effect that show that prototypical sunspots come in pairs with opposite magnetic polarity. From cycle to cycle, the polarities of leading and trailing (with respect to the solar rotation) sunspots change from north/south to south/north and back. Sunspots usually appear in groups.
The sunspot itself can be divided into two parts:
- The central umbra, which is the darkest part, where the magnetic field is approximately vertical (normal to the sun's surface).
- The surrounding penumbra, which is lighter, where the magnetic field lines are more inclined.
Magnetic field lines would ordinarily repel each other, causing sunspots to disperse rapidly, but sunspot lifetime is about two weeks. Recent observations from the Solar and Heliospheric Observatory (SOHO) using sound waves traveling through the Sun's photosphere to develop a detailed image of the internal structure below sunspots show that there is a powerful downdraft underneath each sunspot, forming a rotating vortex that concentrates magnetic field lines. Sunspots are self-perpetuating storms, similar in some ways to terrestrial hurricanes.

Sunspot activity cycles about every eleven years. The point of highest sunspot activity during this cycle is known as Solar Maximum, and the point of lowest activity is Solar Minimum. At the start of a cycle, sunspots tend to appear in the higher latitudes and then move towards the equator as the cycle approaches maximum: this is called Spörer's law.
Today it is known that there are various periods in the Wolf number sunspot index, the most prominent of which is at about 11 years in the mean. This period is also observed in most other expressions of solar activity and is deeply linked to a variation in the solar magnetic field that changes polarity with this period, too.
A modern understanding of sunspots starts with George Ellery Hale, in which magnetic fields and sunspots are linked. Hale suggested that the sunspot cycle period is 22 years, covering two polar reversals of the solar magnetic dipole field. Horace W. Babcock later proposed a qualitative model for the dynamics of the solar outer layers. The Babcock Model explains the behavior described by Spörer's law, as well as other effects, as being due to magnetic fields which are twisted by the Sun's rotation.
Sunspot observation

Sunspots are observed with land-based solar telescopes as well as ones on Earth-orbiting satellites. These telescopes use filtration and projection techniques for direct observation, in additional to filtered cameras of various types. Specialized tools such as spectroscopes and spectrohelioscopes are used to examine sunspots and areas of sunspots. Artificial eclipses allow viewing of the circumference of the sun as sunspots rotate through the horizon.
Since looking directly at the Sun with the naked eye permanently damages vision, amateur observation of sunspots is generally conducted indirectly using projected images, or directly through appropriate protective filters designed for the purpose. Small sections of very dark filter glass, such as a #14 welder's glass are sometimes employed in the latter capacity. The eyepiece of a telescope can also be used to project the image, without filtration, onto a white screen where it can be viewed indirectly, and even traced, so sunspot evolution can be followed. Special purpose hydrogen-alpha narrow bandpass filters as well as aluminum coated glass attenuation filters (which have the appearance of mirrors due to their extremely high optical density) are also used on the front of a telescope to provide safe direct observation through the eyepiece.
Application

Due to their link to other kinds of solar activity, sunspots can be used to predict the space weather and with it the state of the ionosphere. Thus, sunspots can help predict conditions of short-wave radio propagation or satellite communications.
Don Easterbrook, a Professor Emeritus of geology at Western Washington University, has claimed that there is a cause-and-effect relationship between sunspot activity and measured changes in global temperatures on Earth. His statements have added to the controversy over global warming and have placed scientists in different fields of study in opposition to each other. Until more is known about the effects of sunspots and solar radiation levels and their exact relationship with Earth and its weather patterns (including temperature change), a growing number of scientists have accepted that there may be a correlation between global warming and sunspot activity.[12]
Starspots on other stars
Periodic changes in brightness had been first seen on red dwarfs and in 1947 G. E. Kron proposed that spots were the cause.[3] Since the mid 1990s observations of starspots have been made using increasingly powerful techniques yielding more and more detail: photometry determined starspot regions grew and decayed and showed cyclic behaviour similar to the Sun's; spectroscopy examined the structure of starspot regions; Doppler imaging showed differential rotation of spots for several stars and distributions different from the Sun's; spectral line analysis measured the temperature range of spots and the stellar surfaces. For example, in 1999, Strassmeier reported the largest cool starspot ever seen rotating the giant K0 star XX Triangulum (HD 12545) with a temperature of 3,500 kelvin, together with a warm spot of 4,800 kelvin.[3][13]
This section needs expansion. You can help by adding to it. (February 2008) |
Gallery
-
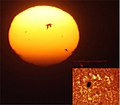 Sunspot 923 at sunset and in solar scope
 -
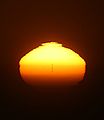 Sunset Superior Mirage of sunspot #930


See also
References
- ^ [1]
- ^ First sunspot of new solar cycle glimpsed, New Scientist (retrieved 8 January 2008).
- ^ a b c press release 990610, K. G. Strassmeier, 1999-06-10, University of Vienna, "starspots vary on the same (short) time scales as Sunspots do", "HD 12545 had a warm spot (350 K above photospheric temperature; the white area in the picture)"
- ^ Sunspot index graphics, Solar Influences Data Analysis Center (retrieved 27 September 2007).
- ^ Solanki, S.K. (2004). "Unusual activity of the Sun during recent decades compared to the previous 11,000 years". Nature. 431: 1084–1087.
{{cite journal}}: Unknown parameter|coauthors=ignored (|author=suggested) (help) - ^ "Solar Forcing of Climate". Climate Change 2001: Working Group I: The Scientific Basis. Retrieved March 10.
{{cite web}}: Check date values in:|accessdate=(help); Unknown parameter|accessyear=ignored (|access-date=suggested) (help) - ^ Weart, Spencer (2006), "Changing Sun, Changing Climate?", in Weart, Spencer (ed.), The Discovery of Global Warming, American Institute of Physics, retrieved 2007-04-14
- ^ Wainwright, G. (2004). Jupiter's influence. New Scientist 2439, 30 (retrieved 27 September 2007).
- ^ Hellemans, Alexander (1988). The Timetables of Science. New York, New York: Simon and Schuster. p. 317. ISBN 0671621300.
{{cite book}}: Unknown parameter|coauthors=ignored (|author=suggested) (help) - ^ [2]
- ^ Michael Asher. (2008). Sun Makes History: First Spotless Month in a Century. DailyTech.
- ^ [3]
- ^ derived images showing rotation of cool and warm starspots
External links
- Solar Cycle 24 and VHF Aurora Website (www.solarcycle24.com)
- Belgium World Data Center for the sunspot index
- High resolution sunspot image
- Sunspot images in high-res Impressive collection of sunspot images
- http://www.tvweather.com/awpage/history_of_the_atmosphere.htm
- NOAA Solar Cycle Progression: Current solar cycle.
- Current conditions: Space weather
- Lockheed Martin Solar and Astrophysics Lab
- Sun|trek website An educational resource for teachers and students about the Sun and its effect on the Earth
- Tools to display the current sunspot number in a browser
- The Sharpest View of the Sun
Sunspot data
- "11,000 Year Sunspot Number Reconstruction". Global Change Master Directory.
{{cite web}}: Unknown parameter|accessdaymonth=ignored (help); Unknown parameter|accessyear=ignored (|access-date=suggested) (help)- "Unusual activity of the Sun during recent decades compared to the previous 11,000 years". WDC for Paleoclimatology.
{{cite web}}: Unknown parameter|accessdaymonth=ignored (help); Unknown parameter|accessyear=ignored (|access-date=suggested) (help)
- "Unusual activity of the Sun during recent decades compared to the previous 11,000 years". WDC for Paleoclimatology.
- "Sunspot Numbers from Ancient Times to Present from NOAA/NGDC". Global Change Master Directory.
{{cite web}}: Unknown parameter|accessdaymonth=ignored (help); Unknown parameter|accessyear=ignored (|access-date=suggested) (help)- "SUNSPOT NUMBERS". NOAA NGDC Solar Data Services.
{{cite web}}: Unknown parameter|accessdaymonth=ignored (help); Unknown parameter|accessyear=ignored (|access-date=suggested) (help)- International Sunspot Number -- sunspot maximum and minimum 1610-present; annual numbers 1700-present; monthly numbers 1749-present; daily values 1818-present; and sunspot numbers by north and south hemisphere. The McNish-Lincoln sunspot prediction is also included.
- American sunspot numbers 1944-present
- Ancient sunspot data 165 BC to 1684 AD
- Group Sunspot Numbers (Doug Hoyt re-evaluation) 1610-1995
- "SUNSPOT NUMBERS". NOAA NGDC Solar Data Services.