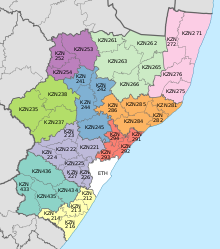
Ulundi Local Municipality
Template:Infobox South African municipality Ulundi Local Municipality is a local municipality located on the southern boundary of the Zululand District Municipality in northeastern KwaZulu-Natal, South Africa. It is a mainly rural municipality that encompasses the town of Ulundi.
Population characteristics
Recent surveys have identified the following characteristics of the municipality's population:[1]
More than half the population is younger than 19 years of age, placing pressure on the need for social facilities. A significant number of these children will be orphaned due to HIV/AIDS.
At least 12% of the population (27 450 people) are already infected with HIV/AIDS. Population growth is expected to decline over the next 20 years.
Education levels are very low; 29% of the population has no formal education.
Income levels are very low; nearly 40% of households have no income. Unemployment levels are very high, with only 12.5% of the total population being formally employed.
The population is predominantly Zulu in ethnicity and culture.
Places of interest
The tourism potential of the area remains largely undeveloped; however, the area features a number of activities and places of interest. These include game reserves, historical/cultural sites, cultural events and guest lodges. Game reserves include the Hluhluwe-Umfolozi Parks, the Ophathe Game Park, the Emakhosini (Valley of the Zulu Kings), the planned Emakhosini-Ophathe Conservancy, and the ThakaZulu Game Reserve. Historical/cultural sites include Nodwengu (King Mpande’s residence and grave), Ulundi Battlefield, Amafa and Dingaan Stat/Piet Retief’s grave.
Main places
The 2001 census divided the municipality into the following main places:[2]
| Place | Code | Area (km2) | Population |
|---|---|---|---|
| Babanango | 53101 | 6.54 | 1,297 |
| Buthelezi Empithimpithini | 53102 | 464.49 | 49,553 |
| Inhlazatshe | 53103 | 13.60 | 1,214 |
| Kwazunyawo | 53104 | 5.91 | 1,298 |
| Mahlabatini | 53105 | 8.21 | 2,342 |
| Mbatha | 53106 | 124.05 | 9,954 |
| Mpungose | 53107 | 158.64 | 27,726 |
| Ndebele | 53108 | 93.44 | 14,799 |
| Nobamba | 53109 | 684.56 | 41,286 |
| Simelane | 53110 | 3.48 | 501 |
| Ulundi | 53111 | 10.27 | 18,420 |
| Ximba | 53112 | 298.34 | 19,330 |
| Zungu | 53113 | 321.98 | 17,228 |
| Remainder of the municipality | 53114 | 1,561.36 | 8,017 |
Politics
The municipal council consists of forty-seven members elected by mixed-member proportional representation. Twenty-four councillors are elected by first-past-the-post voting in twenty-four wards, while the remaining twenty-three are chosen from party lists so that the total number of party representatives is proportional to the number of votes received. In the election of 18 May 2011 the Inkatha Freedom Party (IFP) won a majority of twenty-eight seats on the council. The following table shows the results of the election.[3][4]
style="width: 2px; color:inherit; background-color: #FF0000;" data-sort-value="Inkatha Freedom Party" | style="width: 2px; color:inherit; background-color: #FF8040;" data-sort-value="National Freedom Party" | style="width: 2px; color:inherit; background-color: #006600;" data-sort-value="African National Congress" | style="width: 2px; color:inherit; background-color: #005BA6;" data-sort-value="Democratic Alliance (South Africa)" | style="width: 2px; color:inherit; background-color: #ba0c2f;" data-sort-value="African Christian Democratic Party" | style="width: 2px; color:inherit; background-color: #FFB300;" data-sort-value="United Democratic Movement" | style="width: 2px; color:inherit; background-color: #DCDCDC;" data-sort-value="Independent (politics)" || Party | Votes | Seats | ||||||
|---|---|---|---|---|---|---|---|---|
| Ward | List | Total | % | Ward | List | Total | ||
| IFP | 31,957 | 31,901 | 63,858 | 59.1 | 21 | 7 | 28 | |
| NFP | 15,285 | 15,205 | 30,490 | 28.2 | 3 | 10 | 13 | |
| ANC | 6,599 | 6,469 | 13,068 | 12.1 | 0 | 6 | 6 | |
| DA | 66 | 299 | 365 | 0.3 | 0 | 0 | 0 | |
| ACDP | 33 | 95 | 128 | 0.1 | 0 | 0 | 0 | |
| UDM | 16 | 61 | 77 | 0.1 | 0 | 0 | 0 | |
| Independent | 64 | – | 64 | 0.1 | 0 | – | 0 | |
| Total | 54,020 | 54,030 | 108,050 | 100.0 | 24 | 23 | 47 | |
| Spoilt votes | 529 | 566 | 1,095 | |||||
References
- ^ Integrated Development Plan 2006/2007 to 2011/2012 — June 2009. Ulundi Local Municipality. Retrieved on Oct 11, 2009.
- ^ Lookup Tables - Statistics South Africa
- ^ "Results Summary – All Ballots: Ulundi" (PDF). Independent Electoral Commission. Retrieved 3 December 2013.
- ^ "Seat Calculation Detail: Ulundi" (PDF). Independent Electoral Commission. Retrieved 3 December 2013.

