Wikipedia:Graphics Lab/Resources/Creating shaded relief (GRASS, 3DEM)
Appearance
(Redirected from Wikipedia:Graphics Lab/Resources/Optimizing relief)
The object of this tutorial is to create (composite) relief shadows resulting from a digital elevation model (DEM) created using the programs 3DEM or GRASS GIS.
The tools
[edit]or:
- GRASS GIS (version used: winGRASS 6.3.0RC6): free multi platform GIS program; powerful but more delicate to use;
Potential data sources
[edit]- NASA Shuttle Radar Topography Mission (SRTM) Digital Elevation Model (DEM):
These are bitmap files released into the public domain, compressed into zip file format, which contain the digital topographic data of a given region. The zone covered by the DEMs resulting from the SRTM runs from latitude 56° South to latitude 60° North. These files must be decompressed before being used in 3DEM.
There are three SRTM file types:
- SRTM1 (download here): the most precise data with a resolution of one arcsecond (31 m at the equator), but which are only available for the United States and its dependencies. Each file represents a rectangle of a degree of an arc to a side referenced according to the coordinates of the bottom left corner.[1].
- SRTM3 (download here): a precision of three arcseconds (93 m at the equator) which covers all emerged land between the latitudes indicated above. Filetypes and references identical to SRTM1. These are the datasets which will be of most use for the needs of Wikipedia.
- SRTM30 (download here): a precision of 30 arcseconds (926 m at the equator), adapted for maps covering more than one country or a continent.
- Each map covers a region of 50° of latitude by 40° of longitude, referenced according to the coordinates of the upper left corner. Each map is contained in a specific folder which contains 12 separate files. Only 10 of these will be of use to us; the remaining files
*.jpg.zipand*.gif.zipare just preview files. These 10 files must each be downloaded and decompressed before being used in 3DEM. In the program, select theGTOPO30 Tileoption, then in the new window representing the map of the world, centre the frame on the region of interest and specifyLat/Lonas the projection type. Navigate through the tree and select the.DEMfile.
Creation of shaded relief images
[edit]With GRASS GIS
[edit]
- 1. Open GRASS and enter into the project that follows a UTM projection. Launch the module
r.shaded.relief(Raster -> Terrain analysis -> Shaded relief).

- 2. In the module window, click on the button of the Input elevation map: field and select the DEM map which has previously been imported into GRASS. By default, GRASS uses an illumination coming from the West (270° - from the left), but in cartography the norm has illumination coming from the North-West (upper left corner). This illumination, impossible in reality for the northern hemisphere, has become a convention and in particular avoids the optical illusion of a relief inversion in which one has the impression of seeing valleys as mountains and vice versa. In the field Output shaded relief map name:, enter a name for the first shaded relief map which will be created; for example,
Shadows_315. In the field Altitude of the sun..., specify a value of around60°. For the azimuth, enter315and leave the factor for exaggerating relief field at1, unless the terrain is particularly flat which will result in low visibility shadows. Click on the Run button to start the operation which is detailed in the Output - GIS.m window.

- 3. When the operation has been completed (indicated by the phrase "Shaded relief map created and named <Shadows_315>."), you can preview these shadows to check whether the aspect is correct (the height of the Sun and thus the luminosity of the map, the factor of exaggeration of relief, etc). In the GRASS manager window, create a bitmap layer then click on the Base map button and select the file
Shadows_315. In the Map Display 1 window, click on the Display active layers button to display the map.

- 4. In the
r.shaded.reliefmodule window, change the azimuth to275°. Change the output filename toShadows_275, then click on the Run button. Repeat the operation for an illumination from355°. Close the module.

- 5. Export the first shaded relief map in
PNGformat: File -> Export raster map -> PNG. In ther.out.pngmodule window, select the fileShadows_315. In the field Name for new PNG file:, replace<rasterfilename>withShadows_315, then click on the Run button. The file is saved by default in theC:\GRASSdirectory.
- 6. Modify the output filenames for the other two shaded relief maps. Exit GRASS.
With 3DEM
[edit]
- 1. Open 3DEM. Click on File -> Load Terrain Model (1). Select the SRTM Data option (2) then in the new window files of type
.hgt.

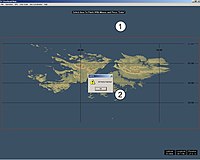
- 2. As the DEM has empty pixels[2], they must be patched: press
F7and select the whole map with the mouse (1). Confirm the selection by pressingEnter. 3DEM fills in these pixels by interpolating values from adjacent pixels. (2)
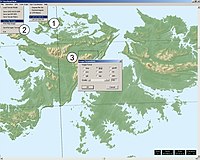
- 3. Change the projection: Operation -> Change Projection -> Convert to UTM Projection (1). Select the WGS84 option (2) which is the norm used by the SRTM files. Click OK. The map is redrawn and the meridians, which were previously parallel, now converge towards the poles.
- Note: The following screen captures show the map with the colours recommended by the suggested Wikipedia map colouring convention, but changing the colours is not a required step in this tutorial.
 |
 |
| Changing the projection | The map showing a UTM projection |

- 4. If, after confirming, a message appears indicating that the map is too large and that a smaller area must be chosen, this means that your map covers more than one UTM zone; an operation that 3DEM is currently not capable of displaying. In such cases it is necessary to crop the map: press
F8and select a smaller area with the mouse over the whole height of the map, then confirm by pressingENTER. Continue with the modification of the projection as indicated in point 3. This action must be repeated for the other part of the map, which requires reloading the relevant DEMs into 3DEM and repeating the operation from point 1.

- 5. Resize the map: press
F6and move the cursor to the required values for height and width.

- 6. Export the map: check that the coordinate grid is visible (Geo Coordinates -> Lat-Lon Grid On) (1), then select File -> Save Map Image (2) and choose
jpegformat (3), and choose a name for the image. Save. This map, compressed into.jpgformat, is only intended to serve as a reference for the transformations required for the final map (rotation, layer alignment etc). Turn off the grid (Geo Coordinates -> Lat-Lon Grid Off).

- 7. Press
F3and modify the colorimetric terrain scale by specifying the colour white for each altitude range, in order to remove topographic information.
- 8. As the DEMs of the SRTM are imprecise in coastal zones[3], we will force 3DEM to consider that there is no ocean to avoid the "stepped" appearance of the coastline in these areas in comparison with the trace produced by the SRTM Water Body Data (SWBD). In the Terrain Type section of the Terrain colors window,
F3, select the option Mountain/Plain: 3DEM applies a grey colour, corresponding to a flat unshadowed plain, to all aquatic surfaces. This method is empiric but adapted to the needs of Wikipedia because it renders these defaults practically invisible.

- 9. Modify the illumination of the map: by default, 3DEM uses an illumination coming from South West (240° - the bottom left corner), which is natural but in cartography the norm is to have illumination coming from the North West (upper left corner). This illumination, impossible in reality for the northern hemisphere, has become a convention and in particular avoids the optical illusion of a relief inversion in which one has the impression of seeing valleys as mountains and vice versa. Click on Color Scale -> Shaded Relief and change the Deg Azimuth field to
315.

- 10. Select File -> Save Map Image, and choose
bmpformat for an optimal quality, then save this image, for example with the nameShadows_315.

- 11. Select Color Scale -> Shaded Relief and this time change the Deg Azimuth field value to
275. Confirm, then save the image inBMPformat with the nameShadows_275.
- 12. Change the illumination source again, this time to
355. Save this third image with the nameShadows_355. Close 3DEM.
External links
[edit]- Reliefshading.com: A site presenting the rules for graphics in cartography and which deals with the question of relief shadows.
- Shadedrelief.com: Tutorial giving further details of this technique.
- GRASS GIS: A Useful Tool for the Mountain Cartographer includes a grass script which allows one to generate a shaded relief of a lat-long DEM while taking into account the horizontal (E-W) stretching which normally makes lat-long reliefs unusable. What this does is allow the relief image for this tutorial to be produced in a single step rather then 3.
Notes
[edit]- ^ Example: the file N48E001.hgt.zip, (decompressed: N48E001.hgt), covers the zone between the 48° and 49° North and 001° and 002° East.
- ^ A defect of SRTM files is that, in spite of the fact that practically all emerged zones have had at least two overflights, certain zones have remained blind to the oblique rays of the radar due to the exaggerated form of the relief.
- ^ A defect of SRTM files is their lack of precision in coastal areas, particularly as a result of wave action which can produce a false radar reading. The SRTM Water Body Data (SWBD) files provided by NASA are intended to resolve this problem.
Sources
[edit]| This page contains a translation of Wikipédia:Atelier graphique/Didacticiels cartographiques/Didacticiel d'optimisation des ombres du relief from fr.wikipedia. |
Links
[edit]
The table above has links to various tutorials and resources which can help in the creation of Wikipedia maps from digital georeferenced data (GIS).


