1984 United States presidential election in Vermont
| ||||||||||||||||||||||||||
| ||||||||||||||||||||||||||
 County Results
Reagan 50–60% 60–70%
| ||||||||||||||||||||||||||
| ||||||||||||||||||||||||||
| Elections in Vermont |
|---|
 |
The 1984 United States presidential election in Vermont took place on November 6, 1984, as part of the 1984 United States presidential election, which was held throughout all 50 states and D.C. Voters chose three representatives, or electors to the Electoral College, who voted for president and vice president.
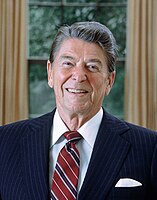
Vermont voted for incumbent Republican President Ronald Reagan over Democratic former Vice President Walter Mondale, by a margin of 17.11%, with Reagan taking 57.92% of the vote to Mondale's 40.81%. This result nonetheless made Vermont 1.1% more Democratic than the nation-at-large.
1984 would prove to be the last election in which Vermont stayed safely in Republican hands. It would go on to become a swing state in the next election, and eventually one of the most heavily Democratic states in the nation after the 1992 election and especially the 2004 election.
While Reagan won the state comfortably, the Republican Party’s shift to the right under his leadership greatly weakened its standing in the Green Mountain State, which was home to a very large number of liberal Republicans. Between 1856 and 1960, Vermont had been the most reliably Republican state in the nation, and prior to Reagan, had voted more Republican than the nation in every election except 1964 (when another staunch conservative, Barry Goldwater, was the Republican nominee).
However, 1984 was the second consecutive election in which the state weighed in as more Democratic than the nation. Nevertheless, Reagan's 135,865 votes is the most received by a Republican presidential candidate in the state's history.
1984 would be the last time in which a Republican presidential nominee carried every county in Vermont, and the last when the GOP carried Addison, Chittenden, Franklin, Grand Isle and Windham Counties.[1]
Results
| 1984 United States presidential election in Vermont[2] | |||||
|---|---|---|---|---|---|
| Party | Candidate | Votes | Percentage | Electoral votes | |
| Republican | Ronald Reagan (incumbent) | 135,865 | 57.92% | 3 | |
| Democratic | Walter Mondale | 95,730 | 40.81% | 0 | |
| Libertarian | David Bergland | 1,002 | 0.43% | 0 | |
| No party | Write-ins | 712 | 0.30% | 0 | |
| Independent | Lyndon LaRouche | 423 | 0.18% | 0 | |
| Liberty Union (New Alliance) | Dennis L. Serrette | 323 | 0.14% | 0 | |
| Citizens | Sonia Johnson | 264 | 0.11% | 0 | |
| Socialist Workers | Melvin T. Mason | 127 | 0.05% | 0 | |
| Communist | Gus Hall | 115 | 0.05% | 0 | |
| Totals | 234,561 | 100.00% | 3 | ||
| Voter Turnout (Voting age/Registered) | 60%/70% | ||||
Results by county
| County | Ronald Wilson Reagan[3] Republican |
Walter Frederick Mondale[3] Democratic |
David Peter Bergland[3] Libertarian |
Various candidates[3] Write-ins |
Various candidates[3] Other parties |
Margin | Total votes cast | ||||||
|---|---|---|---|---|---|---|---|---|---|---|---|---|---|
| # | % | # | % | # | % | # | % | # | % | # | % | ||
| Addison | 7,589 | 58.26% | 5,299 | 40.68% | 46 | 0.35% | 40 | 0.31% | 51 | 0.39% | 2,290 | 17.58% | 13,025 |
| Bennington | 9,035 | 59.11% | 6,039 | 39.51% | 82 | 0.54% | 16 | 0.10% | 112 | 0.73% | 2,996 | 19.60% | 15,284 |
| Caledonia | 7,249 | 68.32% | 3,223 | 30.38% | 48 | 0.45% | 37 | 0.35% | 53 | 0.50% | 4,026 | 37.95% | 10,610 |
| Chittenden | 30,217 | 54.11% | 24,830 | 44.46% | 335 | 0.60% | 206 | 0.37% | 257 | 0.46% | 5,387 | 9.65% | 55,845 |
| Essex | 1,632 | 69.48% | 693 | 29.50% | 5 | 0.21% | 4 | 0.17% | 15 | 0.64% | 939 | 39.97% | 2,349 |
| Franklin | 8,683 | 59.63% | 5,755 | 39.52% | 45 | 0.31% | 27 | 0.19% | 52 | 0.36% | 2,928 | 20.11% | 14,562 |
| Grand Isle | 1,537 | 60.27% | 980 | 38.43% | 15 | 0.59% | 3 | 0.12% | 15 | 0.59% | 557 | 21.84% | 2,550 |
| Lamoille | 4,674 | 62.10% | 2,746 | 36.49% | 32 | 0.43% | 24 | 0.32% | 50 | 0.66% | 1,928 | 25.62% | 7,526 |
| Orange | 6,407 | 60.24% | 4,088 | 38.44% | 46 | 0.43% | 47 | 0.44% | 47 | 0.44% | 2,319 | 21.81% | 10,635 |
| Orleans | 5,966 | 63.53% | 3,294 | 35.08% | 40 | 0.43% | 34 | 0.36% | 57 | 0.61% | 2,672 | 28.45% | 9,391 |
| Rutland | 15,236 | 60.98% | 9,545 | 38.20% | 69 | 0.28% | 35 | 0.14% | 100 | 0.40% | 5,691 | 22.78% | 24,985 |
| Washington | 13,706 | 54.48% | 11,163 | 44.37% | 115 | 0.46% | 59 | 0.23% | 115 | 0.46% | 2,543 | 10.11% | 25,158 |
| Windham | 9,880 | 54.05% | 8,206 | 44.89% | 39 | 0.21% | 60 | 0.33% | 94 | 0.51% | 1,674 | 9.16% | 18,279 |
| Windsor | 14,054 | 57.96% | 9,869 | 40.70% | 85 | 0.35% | 120 | 0.49% | 119 | 0.49% | 4,185 | 17.26% | 24,247 |
| Totals | 135,865 | 57.92% | 95,730 | 40.81% | 1,002 | 0.43% | 712 | 0.30% | 1,252 | 0.53% | 40,135 | 17.11% | 234,561 |
See also
References
- ^ Sullivan, Robert David; ‘How the Red and Blue Map Evolved Over the Past Century’; America Magazine in The National Catholic Review; June 29, 2016
- ^ "1984 Presidential General Election Results - Vermont". Dave Leip's Atlas of U.S. Presidential Elections. Retrieved 2013-02-07.
- ^ a b c d e Our Campaigns; VT US Presidential Election Race; November 06, 1984


