
Insolation: Difference between revisions
→Earth's insolation: add see also, expand wikilink in text |
|||
| Line 226: | Line 226: | ||
== External links == |
== External links == |
||
{{Wiktionary|insolation}} |
{{Wiktionary|insolation}} |
||
* [http://www.poweroak.net solar power pack] |
|||
* [http://www.nsdl.arm.gov/Library/glossary.shtml#insolation National Science Digital Library - Insolation] link broken |
|||
* [http://www.sfog.us/solar/sfsolar.htm San Francisco Solar Map] |
* [http://www.sfog.us/solar/sfsolar.htm San Francisco Solar Map] |
||
* [http://re.jrc.ec.europa.eu/pvgis/apps4/pvest.php European Commission- Interactive Maps] |
* [http://re.jrc.ec.europa.eu/pvgis/apps4/pvest.php European Commission- Interactive Maps] |
||
* [http://www.bom.gov.au/jsp/awap/solar/index.jsp Yesterday‘s Australian Solar Radiation Map] |
* [http://www.bom.gov.au/jsp/awap/solar/index.jsp Yesterday‘s Australian Solar Radiation Map] |
||
* [http://www.poweroak.net/energy-storage-system-c-1.html energy storage system] |
|||
* [http://www.ecmwf.int/research/era/ERA-40_Atlas/docs/section_B/parameter_nsfosrpd.html Net surface fluxes of solar radiation] including interannual variability link broken |
|||
* [http://oceanworld.tamu.edu/resources/ocng_textbook/chapter05/chapter05_06.htm Net surface solar radiation] |
* [http://oceanworld.tamu.edu/resources/ocng_textbook/chapter05/chapter05_06.htm Net surface solar radiation] |
||
* [http://www.soda-is.com/eng/map/ Maps of Solar Radiation] |
* [http://www.soda-is.com/eng/map/ Maps of Solar Radiation] |
||
Revision as of 03:29, 23 July 2015

Insolation (from Latin insolare, to expose to the sun)[1][2] is the total amount of solar radiation energy received on a given surface area during a given time. It is also called solar irradiation.
Units
It is expressed as "hourly irradiation" if recorded during an hour or "daily irradiation" if recorded during a day.
The unit recommended by the World Meteorological Organization is the megajoule per square metre (MJ/m2) or joule per square millimetre (J/mm2).[3]
An alternate unit of measure is the Langley (1 thermochemical calorie per square centimeter or 41,840 J/m2). Practitioners in the solar energy business may use watt-hour per square metre (Wh/m2). If this energy is divided by the recording time in hours, it is then a density of power called irradiance, expressed in watts per square metre (W/m2).
Absorption and reflection
The object or surface that solar radiation strikes may be a planet, a terrestrial object inside the atmosphere of a planet, or an object exposed to solar rays outside of an atmosphere, such as a spacecraft. Some of the radiation will be absorbed and the remainder reflected. Usually the absorbed radiation is converted to thermal energy, increasing the object's temperature. Manmade or natural systems, however, may convert a portion of the absorbed radiation into another form, as in the case of photovoltaic cells or plants. The proportion of radiation reflected or absorbed depends on the object's reflectivity or albedo.
Projection effect

The insolation into a surface is largest when the surface directly faces the sun. As the angle increases between the direction at a right angle to the surface and the direction of the rays of sunlight, the insolation is reduced in proportion to the cosine of the angle; see effect of sun angle on climate.
In this illustration, the angle shown is between the ground and the sunbeam rather than between the vertical direction and the sunbeam; hence the sine rather than the cosine is appropriate. A sunbeam one mile (1.6 km) wide falls on the ground from directly overhead, and another hits the ground at a 30° angle to the horizontal. Trigonometry tells us that the sine of a 30° angle is 1/2, whereas the sine of a 90° angle is 1. Therefore, the sunbeam hitting the ground at a 30° angle spreads the same amount of light over twice as much area (if we imagine the sun shining from the south at noon, the north-south width doubles; the east-west width does not). Consequently, the amount of light falling on each square mile is only half as much.
This 'projection effect' is the main reason why the polar regions are much colder than equatorial regions on Earth. On an annual average the poles receive less insolation than does the equator, because at the poles the Earth's surface is angled away from the sun. A lower angle also means that the sunbeam must travel through more of earth's atmosphere. This causes a degree of attenuation which contributes to the overall effect of low insolation in polar regions where the angle of the sun is always low.
Earth's insolation

Direct insolation is the solar irradiance measured at a given location on Earth with a surface element perpendicular to the Sun's rays, excluding diffuse insolation (the solar radiation that is scattered or reflected by atmospheric components in the sky). Direct insolation is equal to the solar constant minus the atmospheric losses due to absorption and scattering. While the solar constant varies with the Earth-Sun distance and solar cycles, the losses depend on the time of day (length of light's path through the atmosphere depending on the Solar elevation angle), cloud cover, moisture content and other contents. Insolation is a fundamental abiotic factor[4] that affects plant metabolism and animal behavior.
Over the course of a year the average solar radiation arriving at the top of the Earth's atmosphere at any point in time is roughly 1366 W/m2 [5][6] (see solar constant). The radiant power is distributed across the entire electromagnetic spectrum, although most is in the visible light portion of the spectrum. The Sun's rays are attenuated as they pass through the atmosphere, thus reducing the irradiance at the Earth's surface to approximately 1000 W /m2 for a surface perpendicular to the Sun's rays at sea level on a clear day.[clarification needed]

The actual figure varies with the Sun angle at different times of year, depending on the distance the sunlight travels through the air and the extent of atmospheric haze and cloud cover. Ignoring clouds, the daily average irradiance for the Earth is approximately 250 W/m2 (i.e., a daily irradiation of 6 kWh/m2).
The insolation of the sun can also be expressed in Suns, where one Sun equals 1000 W/m2 at the point of arrival, with kWh/m2/day expressed as hours/day.[7] When calculating the output of, for example, a photovoltaic panel, the angle of the sun relative to the panel needs to be considered as well as the insolation. (Insolation is multiplied by the cosine of the angle between the normal to the panel and the direction of the sun from it). One Sun is a unit of power flux, not a standard value for actual insolation. Sometimes this unit is referred to as a Sol, not to be confused with a sol, meaning one solar day on a different planet, such as Mars.[8]
Solar potential maps
-
 North America
 -
 South America
 -
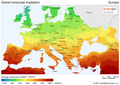 Europe
 -
 Africa and Middle East
 -
 South and South-East Asia
 -
 Australia


Distribution of insolation at the top of the atmosphere


The theory for the distribution of solar radiation at the top of the atmosphere concerns how the solar irradiance at the top of the atmosphere is determined by the sphericity and orbital parameters of Earth. The theory could be applied to any unidirectional beam of radiation incident to a rotating sphere, but is most usually applied to sunlight and in particular for application in numerical weather prediction and theory of the seasons and the ice ages. The last application is known as Milankovitch cycles.
The derivation of distribution is based on a fundamental identity from spherical trigonometry, the spherical law of cosines:

where a, b and c are arc lengths, in radians, of the sides of a spherical triangle. C is the angle in the vertex opposite the side which has arc length c. Applied to the calculation of solar zenith angle Θ, we equate the following for use in the spherical law of cosines:


The separation of Earth from the sun can be denoted RE and the mean distance can be denoted R0, approximately 1 AU. The insolation onto a plane normal to the solar radiation, at 1 AU from the sun, is the solar constant, denoted S0. The solar flux density (insolation) onto a plane tangent to the sphere of the Earth, but above the bulk of the atmosphere (elevation 100 km or greater) is:

and

The average of Q over a day is the average of Q over one rotation, or the hour angle progressing from h = π to h = −π:

Let h0 be the hour angle when Q becomes positive. This could occur at sunrise when , or for h0 as a solution of


or

If tan(φ)tan(δ) > 1, then the sun does not set and the sun is already risen at h = π, so ho = π. If tan(φ)tan(δ) < −1, the sun does not rise and .

is nearly constant over the course of a day, and can be taken outside the integral


![{\displaystyle \int _{\pi }^{-\pi }Q\,dh=S_{o}{\frac {R_{o}^{2}}{R_{E}^{2}}}\left[h\sin(\phi )\sin(\delta )+\cos(\phi )\cos(\delta )\sin(h)\right]_{h=h_{o}}^{h=-h_{o}}}](https://wikimedia.org/api/rest_v1/media/math/render/svg/0b933fb672a21f2ee1d55d5afd1151a813193112)
![{\displaystyle \int _{\pi }^{-\pi }Q\,dh=-2S_{o}{\frac {R_{o}^{2}}{R_{E}^{2}}}\left[h_{o}\sin(\phi )\sin(\delta )+\cos(\phi )\cos(\delta )\sin(h_{o})\right]}](https://wikimedia.org/api/rest_v1/media/math/render/svg/d3a6cfe297676d2bf4901ab29dd1ac59494708a8)
![{\displaystyle {\overline {Q}}^{\text{day}}={\frac {S_{o}}{\pi }}{\frac {R_{o}^{2}}{R_{E}^{2}}}\left[h_{o}\sin(\phi )\sin(\delta )+\cos(\phi )\cos(\delta )\sin(h_{o})\right]}](https://wikimedia.org/api/rest_v1/media/math/render/svg/37e20bedaf32de24aeec5d44dd338414b928ee56)
Let θ be the conventional polar angle describing a planetary orbit. For convenience, let θ = 0 at the vernal equinox. The declination δ as a function of orbital position is

where ε is the obliquity. The conventional longitude of perihelion ϖ is defined relative to the vernal equinox, so for the elliptical orbit:

or

With knowledge of ϖ, ε and e from astrodynamical calculations [9] and So from a consensus of observations or theory, can be calculated for any latitude φ and θ. Note that because of the elliptical orbit, and as a simple consequence of Kepler's second law, θ does not progress uniformly with time. Nevertheless, θ = 0° is exactly the time of the vernal equinox, θ = 90° is exactly the time of the summer solstice, θ = 180° is exactly the time of the autumnal equinox and θ = 270° is exactly the time of the winter solstice.
Application to Milankovitch cycles
Obtaining a time series for a for a particular time of year, and particular latitude, is a useful application in the theory of Milankovitch cycles. For example, at the summer solstice, the declination δ is simply equal to the obliquity ε. The distance from the sun is

For this summer solstice calculation, the role of the elliptical orbit is entirely contained within the important product , which is known as the precession index, the variation of which dominates the variations in insolation at 65° N when eccentricity is large. For the next 100,000 years, with variations in eccentricity being relatively small, variations in obliquity will be dominant.


Applications
Insolation is the primary variable affecting equilibrium temperature in spacecraft design and planetology.
In construction, insolation is an important consideration when designing a building for a particular climate. It is one of the most important climate variables for human comfort and building energy efficiency.[10]

The projection effect can be used in architecture to design buildings that are cool in summer and warm in winter, by providing large vertical windows on the equator-facing side of the building (the south face in the northern hemisphere, or the north face in the southern hemisphere): this maximizes insolation in the winter months when the Sun is low in the sky and minimizes it in the summer when the Sun is high in the sky. (The Sun's north/south path through the sky spans 47 degrees through the year).
Insolation figures are used as an input to worksheets to size solar power systems for the location where they will be installed.[11] This can be misleading since insolation figures assume the panels are parallel with the ground, when in fact (except for asphalt solar collectors)[12] they are almost always mounted at an angle[13] towards the sun. This gives inaccurately low estimates for winter.[14] The figures can be obtained from an insolation map or by city or region from insolation tables that reflect data over the prior 30–50 years. Photovoltaic panels are rated under standard conditions to determine the Wp rating (watts peak),[15] which can then be used with insolation to determine the expected output, adjusted by other factors such as tilt, tracking and shading (which can be included to create the installed Wp rating).[16] Insolation values range from 800 to 950 kWh/(kWp·y) in Norway to up to 2,900 in Australia.
In civil engineering and hydrology, numerical models of snowmelt runoff use observations of insolation. This permits estimation of the rate at which water is released from a melting snowpack. Field measurement is accomplished using a pyranometer.
| Conversion factor (multiply top row by factor to obtain side column) | |||||
|---|---|---|---|---|---|
| W/m2 | kW·h/(m2·day) | sun hours/day | kWh/(m2·y) | kWh/(kWp·y) | |
| W/m2 | 1 | 41.66666 | 41.66666 | 0.1140796 | 0.1521061 |
| kW·h/(m2·day) | 0.024 | 1 | 1 | 0.0027379 | 0.0036505 |
| sun hours/day | 0.024 | 1 | 1 | 0.0027379 | 0.0036505 |
| kWh/(m2·y) | 8.765813 | 365.2422 | 365.2422 | 1 | 1.333333 |
| kWh/(kWp·y) | 6.574360 | 273.9316 | 273.9316 | 0.75 | 1 |
See also
References
- ^ "Insolation - Definition of insolation by Merriam-Webster". merriam-webster.com.
- ^ "Online Etymology Dictionary". etymonline.com.
- ^ WMO Webteam. "World Meteorological Organization - WMO" (PDF). wmo.int.
- ^ C.Michael Hogan. 2010. Abiotic factor. Encyclopedia of Earth. eds Emily Monosson and C. Cleveland. National Council for Science and the Environment. Washington DC
- ^ Satellite observations of total solar irradiance
- ^ "Construction of a Composite Total Solar Irradiance (TSI) Time Series from 1978 to present". Figure 4 & figure 5. Retrieved February 2, 2009.
- ^ U.S. Solar Radiation Resource Maps retrieved 29 October 2012
- ^ Michael Allison; Robert Schmunk (5 August 2008). "Technical Notes on Mars Solar Time". NASA. Retrieved 16 January 2012.
{{cite web}}: Unknown parameter|last-author-amp=ignored (|name-list-style=suggested) (help) - ^ [1] [dead link]
- ^ Nall, D. H. "Looking across the water: Climate-adaptive buildings in the United States & Europe" (PDF). The Construction Specifier. 57 (2004–11): 50–56.
- ^ "Determining your solar power requirements and planning the number of components".
- ^ "Asphalt Solar Collector Renewable Heat for IHT - Solar Collectors - Solar Recharge for GSHP - Pavement Solar Collectors - Road Solar Thermal Collector". icax.co.uk.
- ^ "Optimum solar panel angle". macslab.com.
- ^ "Heliostat Concepts". redrok.com.
- ^ [2] [dead link]
- ^ How Do Solar Panels Work?
External links
- solar power pack
- San Francisco Solar Map
- European Commission- Interactive Maps
- Yesterday‘s Australian Solar Radiation Map
- energy storage system
- Net surface solar radiation
- Maps of Solar Radiation
- Solar Radiation using Google Maps
- Sample Calculations based on US Insolation Map
- Solar Radiation on a Tilted Collector (U.S.A. only) choose "Theoretically Perfect Collector" to receive results for the insolation on a tilted surface
- Annual Optimal Orientation of Fixed Tilt Solar Collectors (U.S.A. only)
- SMARTS, software to compute solar insolation of each date/location of earth [3]
- Solar Radiation and Clouds - A Discussion
- NASA Surface meteorology and Solar Energy
- insol: R package for insolation on complex terrain
- Online insolation calculator