
Laffer curve: Difference between revisions
Citation bot (talk | contribs) m Citation maintenance. Formatted: pages. You can use this bot yourself! Please report any bugs. |
No edit summary |
||
| Line 3: | Line 3: | ||
In [[economics]], the '''Laffer curve''' is used to illustrate the idea that increases in the rate of [[taxation]] do not necessarily increase [[tax revenue]]. (For instance, a 100 percent [[income tax]] will generate no revenue, as citizens will have no [[incentive]] to make money). Increasing taxes beyond the peak of the curve point will decrease tax revenue. The Laffer curve was popularized by [[Arthur Laffer]] (b. 1940) in the 1980s. However, the idea is not new to him, nor did he claim as much: it dates to the 14th century North African polymath [[Ibn Khaldun]], who discusses the idea in his 1377 ''[[Muqaddimah]].'' More recently, in his ''[[General Theory of Employment, Interest, and Money]]'', [[John Maynard Keynes]] described how past a certain point, increasing taxation would lower revenue and vice versa.<ref name="John Maynard Keynes">John Maynard Keynes, The Collected Writings of John Maynard Keynes (London: Macmillan, Cambridge University Press, 1972).</ref> |
In [[economics]], the '''Laffer curve''' is used to illustrate the idea that increases in the rate of [[taxation]] do not necessarily increase [[tax revenue]]. (For instance, a 100 percent [[income tax]] will generate no revenue, as citizens will have no [[incentive]] to make money). Increasing taxes beyond the peak of the curve point will decrease tax revenue. The Laffer curve was popularized by [[Arthur Laffer]] (b. 1940) in the 1980s. However, the idea is not new to him, nor did he claim as much: it dates to the 14th century North African polymath [[Ibn Khaldun]], who discusses the idea in his 1377 ''[[Muqaddimah]].'' More recently, in his ''[[General Theory of Employment, Interest, and Money]]'', [[John Maynard Keynes]] described how past a certain point, increasing taxation would lower revenue and vice versa.<ref name="John Maynard Keynes">John Maynard Keynes, The Collected Writings of John Maynard Keynes (London: Macmillan, Cambridge University Press, 1972).</ref> |
||
The Laffer-curve is central to [[supply side economics]], as it provides an argument for why lowering taxation may actually increase tax revenues. Many economists have questioned the utility of the Laffer Curve in public discourse. |
The Laffer-curve is central to [[supply side economics]], as it provides an argument for why lowering taxation may actually increase tax revenues. Many economists have questioned the utility of the Laffer Curve in public discourse. |
||
Note that Laffer himself does not claim credit for the idea,<ref name="Laffter at Heritage"/> although he does seem to be responsible for popularizing the concept and its implications to policy makers. |
Note that Laffer himself does not claim credit for the idea,<ref name="Laffter at Heritage"/> although he does seem to be responsible for popularizing the concept and its implications to policy makers. |
||
Revision as of 00:20, 5 April 2009

In economics, the Laffer curve is used to illustrate the idea that increases in the rate of taxation do not necessarily increase tax revenue. (For instance, a 100 percent income tax will generate no revenue, as citizens will have no incentive to make money). Increasing taxes beyond the peak of the curve point will decrease tax revenue. The Laffer curve was popularized by Arthur Laffer (b. 1940) in the 1980s. However, the idea is not new to him, nor did he claim as much: it dates to the 14th century North African polymath Ibn Khaldun, who discusses the idea in his 1377 Muqaddimah. More recently, in his General Theory of Employment, Interest, and Money, John Maynard Keynes described how past a certain point, increasing taxation would lower revenue and vice versa.[1]
The Laffer-curve is central to supply side economics, as it provides an argument for why lowering taxation may actually increase tax revenues. Many economists have questioned the utility of the Laffer Curve in public discourse.
Note that Laffer himself does not claim credit for the idea,[2] although he does seem to be responsible for popularizing the concept and its implications to policy makers.
| Public finance |
|---|
 |
Theory
The curve is most easily understood by considering the two extremes of income taxation—0 percent and 100 percent. At the lower extreme, a 0 percent tax rate means the government's revenue is, of course, zero. At the other extreme, where there is a 100 percent tax rate, the government theoretically collects zero revenue because (in a "rational" economic model) taxpayers would change their behavior in response to the tax rate: either they have no incentive to work or they find a way to avoid paying taxes, so the government collects 100% of nothing. (However, the government may still collect some revenue if some taxpayers are not "economically rational", or if tax evasion lowers the effective tax rate.) Somewhere between 0% and 100%, therefore, lies a tax rate that will maximize revenue. Graphical representations of the curve such as the one above may superficially appear to put the rate at around 50%, but the optimal rate could theoretically be any percentage between 0% and 100%.
The point at which the curve achieves its maximum is subject to much theoretical speculation. It will vary from one economy to another and depends on the elasticity of supply for labor and various other factors. It is therefore expected to vary with time even in the same economy. Complexities arise when taking into account possible differences in incentive to work for different income groups and when introducing progressive taxation. The structure of the curve may also be changed by other policy decisions, for example, if tax loopholes and off-shore tax shelters are made more readily available by legislation, the point at which revenue begins to decrease with increased taxation will become lower.
The curve is primarily used by advocates who want government to reduce tax rates (such as those on capital gains) and believe that the optimum tax rate is below the current tax rate. In that case, a reduction in tax rates will actually increase government revenue and not need to be offset by decreased government spending or increased borrowing.
Tangible evidence in the U.S.
In 1924, Secretary of Treasury Andrew Mellon wrote, "It seems difficult for some to understand that high rates of taxation do not necessarily mean large revenue to the Government, and that more revenue may often be obtained by lower rates." Exercising his understanding that "73% of nothing is nothing" he pushed for the reduction of the top income tax bracket from 73% to an eventual 24% (as well as tax breaks for lower brackets). Personal income-tax receipts rose from $719 million in 1921 to over $1 billion in 1929, which supporters attribute to the rate cut. [3]
Context in U.S. history
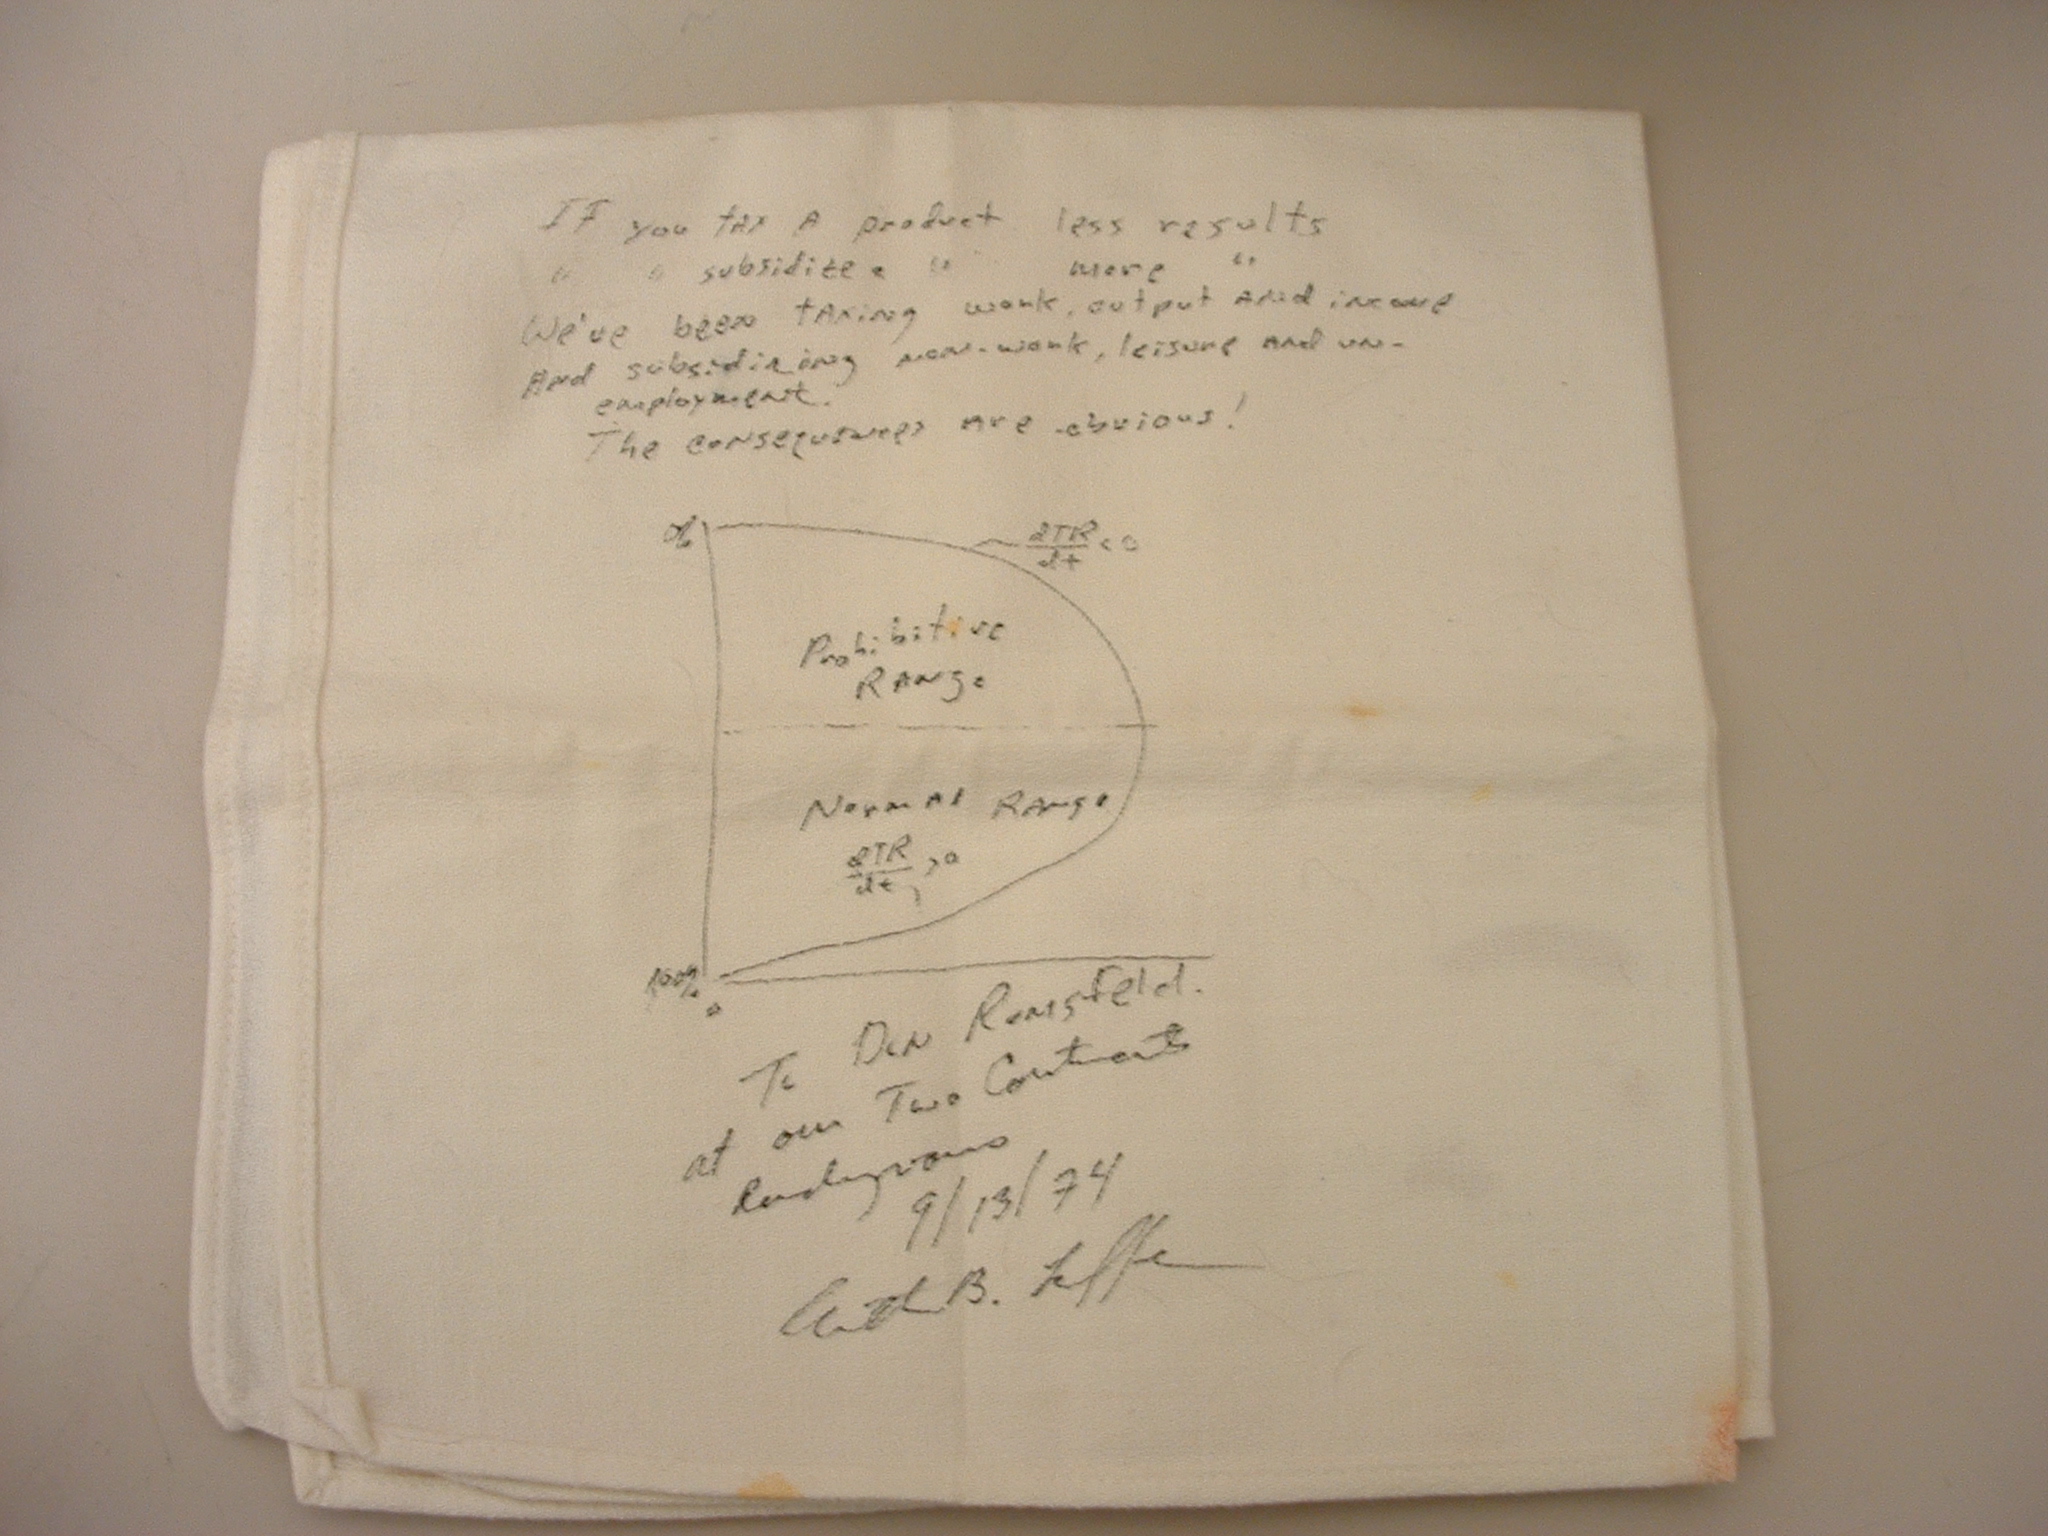
Laffer himself does not claim to have invented the concept, attributing it to 14th century Muslim scholar Ibn Khaldun and, more recently, to John Maynard Keynes. Laffer also emphasized the main utility of the curve is as a pedagogical device. The term was reportedly coined by Jude Wanniski (a writer for The Wall Street Journal) after a 1974 afternoon meeting between Laffer, Wanniski, Dick Cheney, Donald Rumsfeld, and his deputy press secretary Grace-Marie Arnett (Wanniski, 2005; Laffer, 2004). In this meeting, Laffer, arguing against President Gerald Ford's tax increase, reportedly sketched the curve on a napkin[4] to illustrate the concept. Cheney did not buy the idea of supply-side economics immediately, but the idea caught the imaginations of those present[5]. Laffer professes no recollection of this napkin, but writes, "I used the so-called Laffer Curve all the time in my classes and with anyone else who would listen to me" (Laffer, 2004).
The Laffer curve and supply side economics inspired the Kemp-Roth Tax Cut of 1981. Supply-side advocates of tax cuts claimed that lower tax rates would generate more tax revenue because the United States government's marginal income tax rates prior to the legislation were on the right-hand side of the curve.
David Stockman, President Ronald Reagan's budget director during his first administration and one of the early proponents of supply-side economics, maintained that the Laffer curve was not to be taken literally — at least not in the economic environment of the 1980s United States. In The Triumph of Politics, he writes:
- [T]he whole California gang had taken [the Laffer curve] literally (and primitively). The way they talked, they seemed to expect that once the supply-side tax cut was in effect, additional revenue would start to fall, manna-like, from the heavens. Since January, I had been explaining that there is no literal Laffer curve.
Empirical evidence
Laffer, in an article published at the Heritage Foundation, has pointed to Russia and the Baltic states who have recently instituted a flat tax with rates lower than 35%, and whose economies started growing soon after implementation. He has also referred to the economic success following the Kemp-Roth tax act, the Kennedy tax cuts, the 1920s tax cuts, and the changes in US capital gains tax structure in 1997 as examples of how tax cuts can cause the economy to grow and thus increase tax revenue.[2] Others have noted that federal revenues, as a percentage of GDP, have remained stable at approximately 19.5% over the period 1950 to 2007 despite significant changes in margin tax rates over the same period. They argue that since federal revenue is proportional to GDP, the key factor in increasing revenue is to increase GDP.[6]
At least one empirical study, looking at actual historical data on tax rates, GDP, and revenue, placed the revenue-maximizing tax rate (the point at which another marginal tax rate increase would decrease tax revenue) as high as 80%.[citation needed] Paul Samuelson argues in his popular economic textbook that Reagan was correct in a very limited sense to view the intuition underlying the Laffer curve as accurate, because as a successful actor, Reagan was subject to marginal tax rates as high as 90% during World War II. The point is that in a progressive tax system, any given person's perspective on the point on the curve where the economy currently sits will be influenced by the marginal tax rate to which that person's income is subject.
Current CBO estimates of the effectiveness of the Laffer curve
In 2005, the Congressional Budget Office released a paper called "Analyzing the Economic and Budgetary Effects of a 10 Percent Cut in Income Tax Rates" that casts doubt on the idea that tax cuts ultimately improve the government's fiscal situation. Unlike earlier research, the CBO paper estimates the budgetary impact of possible macroeconomic effects of tax policies, i.e., it attempts to account for how reductions in individual income tax rates might affect the overall future growth of the economy, and therefore influence future government tax revenues; and ultimately, impact deficits or surpluses. The paper's author forecasts the effects using various assumptions (e.g., people's foresight, the mobility of capital, and the ways in which the federal government might make up for a lower percentage revenue). Even in the paper's most generous estimated growth scenario, only 28% of the projected lower tax revenue would be recouped over a 10-year period after a 10% across-the-board reduction in all individual income tax rates. The paper points out that these projected shortfalls in revenue would have to be made up by federal borrowing: the paper estimates that the federal government would pay an extra $200 billion in interest over the decade covered by his analysis.[7]
Critics at the Cato Institute have charged that to support these calculations, the paper assumes that the 10% reduction in individual tax rates would only result in a 1% increase in gross national product, a figure they consider too low for current marginal tax rates in the United States.[8]
Influence beyond the U.S.
Between 1979 and 2002, more than 40 other countries, including the UK,Belgium, Denmark, Finland, France, Germany, Norway, and Sweden, cut their top rates of personal income tax. In an article about this, Alan Reynolds, a senior fellow with the Cato Institute, wrote, "Why did so many other countries so dramatically reduce marginal tax rates? Perhaps they were influenced by new economic analysis and evidence from... supply-side economics. But the sheer force of example may well have been more persuasive. Political authorities saw that other national governments fared better by having tax collectors claim a medium share of a rapidly growing economy (a low marginal tax) rather than trying to extract a large share of a stagnant economy (a high average tax)." [9]
Criticism
Conventional economic paradigms acknowledge the basic notion of the Laffer curve, but they argue that government was operating on the left-hand side of the curve, so a tax cut would thus lower revenue. The central question is the elasticity of work with respect to tax rates. For example, Pecorino (1995) argued that the peak occurred at tax rates around 65%, and summarized the controversy as:
- Just about everyone can agree that if an increase in tax rates leads to a decrease in tax revenues, then taxes are too high. It is also generally agreed that at some level of taxation, revenues will turn down. Determining the level of taxation where revenues are maximized is more controversial.[10]
Incorrect assumptions
The Laffer Curve assumes that the Government will collect no tax at a 100% tax rate because, rationally, no person will choose to carry out work if they receive none of the economic return from that work. However some economists question whether this assumption is correct.[11] They argue, for example, that in classically structured Communist societies there was an effective 100% tax rate and yet, while these societies may have been highly inefficient, people did continue to work to some extent.
However, in practical Communist societies such as the now-defunct Soviet Union, all workers were paid some wage, usually tied to the level of demand for their services much like in capitalist societies. They also were given government subsidized food, public transportation, and housing associated with the level of their occupation and its importance to the central government. Combined, these "benefits" could be considered income.
The result of these low-paying and highly subsidized systems is a very high effective rate of taxation with little left to the worker in terms of disposable income. Since much of the worker's true productivity is returned to him in a manner not of his choosing and all similar workers receive the same benefits regardless of the degree of their efforts, there is little incentive to produce in terms of quality or quantity. This is the classic case of an economic system operating on the right half of the Laffer curve, where oppressive government taxation severely dampens economic activity.
The very low productivity and wage levels of the old Soviet system were the basis of what has been called the "Soviet National Joke": "We pretend to work; they pretend to pay us!".
In popular culture
This article contains a list of miscellaneous information. (February 2008) |
- Jackie Mason can be seen making an indirect reference to this phenomenon in "The World According to Me" (while describing Reagan's tax policies).
- Ben Stein spends time explaining this to a class of teenagers in Ferris Bueller's Day Off.
See also
- Trickle-down economics
- Supply-side economics
- Reaganomics
- Macroeconomics
- List of economics topics
- Lawrence Kudlow
- Hauser's Law
Notes
- ^ John Maynard Keynes, The Collected Writings of John Maynard Keynes (London: Macmillan, Cambridge University Press, 1972).
- ^ a b "Laffer, A. (June 1, 2004). The Laffer Cruve, Past, Present and Future. Retrieved from the Heritage Foundation". Retrieved 2007-12-11.
- ^ Folsom Jr., Burton W., "The Myth of the Robber Barons", page 103. Young America's Foundation, 2007.
- ^ http://www.polyconomics.com/gallery/Napkin003.jpg
- ^ Gellman, Barton, 258. Angler: The Cheney Vice Presidency, Penguin Press, New York 2008.
- ^ DAVID RANSON, "You Can't Soak the Rich,", The Wall Street Journal, May 20, 2008; Page A23
- ^ "CBO. (December 1, 2005). Analyzing the Economic and Budgetary Effects of a 10 Percent Cut in Income Tax Rates" (PDF). Retrieved 2007-12-11.
- ^ Moore, Stephen (2003-03-18). "President Bush's Economic Growth Tax Cut". CATO Institute. Retrieved 2007-12-11.
- ^ Marginal Tax Rates, by Alan Reynolds
- ^ Pecorino, Paul (1995), "Tax rates and tax revenues in a model of growth through human capital accumulation", Journal of Monetary Economics, 36 (3): 527–539
{{citation}}: External link in|title= - ^ Chait, J. (September 10, 2007). Feast of the Wingnuts: How economic crackpots devoured American politics. The New Republic, 237, 27-31
External links
- Arthur Laffer describing the Laffer Curve, at the conservative Heritage Foundation
- The Logic of the Laffer Curve