Fault trace


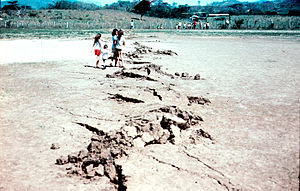
A fault trace describes the intersection of a geological fault with the Earth's surface, which leaves a visible disturbance on the surface, usually looking like a crack in the surface with jagged rock structures protruding outward. The term also applies to a line plotted on a geological map to represent a fault. These fractures tend to occur when a slip surface expands from a fault core, especially during an earthquake. This tends to occur with fault displacement, in which surfaces on both sides of a fault, known as fault blocks, separate horizontally or vertically.[1]
Traces caused by different faults
Faults, at the broadest level, can be differentiated by the relative motion between their fault blocks.
Horizontal motion is indicative of what is known as a strike-slip fault and does not usually show much vertical separation. This is when the motion along the fault is parallel to the fault trace, usually caused by underlying plate tectonics . These fault traces are often identified by some kind of linear feature on the surface such as a fence line or small stream that has been offset. There are many photos of straight fences that suddenly jump over a meter or two leaving a gap in between. In nature, linear features are uncommon and can help identify geologic features like faults because of their linear fault traces.[2]
Dip separation can also occur when motion of the fault is perpendicular to the fault trace. That is, the fault blocks are pulled away from each other or pushed towards each other. This is known as a dip-slip fault. This causes vertical separation between the blocks as one is dropped down in the space created by extensional forces, or one block is shoved up on top of the other by compressional forces. Again, the underlying regional plate tectonics are often responsible for the type of fault and associated trace. This vertical separation reveals a new face which had previously been buried and extends along the length of the fault trace. This new face is a specific type of fault trace known as a fault scarp.[3]
Indicators
Scarps

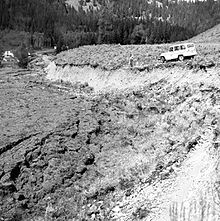
As mentioned above, a scarp is a formation caused by vertical offset between two fault blocks. Fault scarps can be seen as meter high faces abruptly jutting out of the surface, or a small face only a few centimeters high which will be smoothed out quickly by mass wasting and erosional forces.
Vegetation changes
As a fault moves, the material both at and beneath the surface gets disturbed. These disturbances often cause different rocks and sediment, which are composed of different minerals, as well as fluids to be brought to the surface. Different minerals can contain different nutrients and elements that either enrich soils around them, or alter them in such a way that makes it more difficult for plants to grow. These changes in the soil can cause noticeable changes in the vegetation and form a fault trace.
Lineations
Not only are large scale linear features indicative of fault traces but small lineations found on rock samples or rock faces also are. Slickenlines are one type of lineation which are linear gouges scraped into a rock from different rocks grinding along against each other. Slickenlines indicate a fault as well as its motion, which can be very useful in many studies.
Topographic changes
Similar to fault scarps, and often displayed as them, elevation changes can often be good indicators of a fault. A portion of the land can be dropped down or thrust up during faulting and these can be obvious fault trace indicators, especially if seen in linear formations.
Riedel shears
Riedel shear structures are common structures that can be identified within shear zones. These structures form during the early stages of fault development and eventually link up with each other in linear orientation to form a complete fault.[4]
Fault traces on Mars
Mars has always been an interesting topic across scientific disciplines. The possibility of life existing on another planet has intrigued many throughout history and identifying features like faults could mean that there are more forces at work than previously thought. Using images captured by the Viking, Mars Express, Mars Reconnaissance Orbiter and Mars Odyssey missions, a 2008 study was able to identify a series of faults on the surface of Mars based on how their traces are expressed. These traces appear as erosion resistant ridges thought to have been formed by water deposited minerals within ancient fault zones. Finding these fault traces means that there may have been plate tectonics, geothermal interactions, and movement of ground water at some point in the planets history. These factors all have major potential to influence the chances of living organisms existing there.[5]
Fault traces and remote sensing
Because of the rarity of linear features found in nature, technologies which allow for large scale map view analysis of the earth's surface have been increasingly helpful in revealing fault traces that have otherwise remained unrecognized. Remote Sensing techniques use imagery acquired by sensors mounted on satellites, aircraft, or even handheld to view different parts of the earth at different scales. Large scale images often unveil features that were difficult or impossible to see from previous available perspectives. Sudden 90 degree bends or jogs in a stream, or even an extended straight stretch could be possible indicators of a fault trace but when put into larger perspective can be aligned with other pieces of evidence to add confirmation. There could be a gentle elevation change that don't seem suspicious when walking over it, but when viewed remotely can show that it extends laterally in a straight line and could be evidence of an old fault scarp. Not only can Remote Sensing be useful in locating new fault traces, but it can also provide useful information when monitoring motion and identifying characteristics of known faults.[6]
Fault traces on geologic maps
On a geologic map, fault traces are drawn in as lines. Direction of dip, degree of dip, type of fault, and motion along the fault can all be indicated using different symbols.
See also
Sources
References
- ^ Torabi, Anita; Berg, Silje Støren (2011-08-01). "Scaling of fault attributes: A review". Marine and Petroleum Geology. 28 (8): 1444–1460. doi:10.1016/j.marpetgeo.2011.04.003. ISSN 0264-8172.
- ^ Balance, P. F. (2009-04-08). Sedimentation in Oblique-slip Mobile Zones. John Wiley & Sons. ISBN 978-1-4443-0374-2.
- ^ Bouchon, Michel (1980). "The motion of the ground during an earthquake: 2. The case of a dip slip fault". Journal of Geophysical Research: Solid Earth. 85 (B1): 367–375. doi:10.1029/JB085iB01p00367. ISSN 2156-2202.
- ^ Katz, Yoram; Weinberger, Ram; Aydin, Atilla (2004-03-01). "Geometry and kinematic evolution of Riedel shear structures, Capitol Reef National Park, Utah". Journal of Structural Geology. 26 (3): 491–501. doi:10.1016/j.jsg.2003.08.003. ISSN 0191-8141.
- ^ Treiman, Allan H. (March 2008). "Ancient groundwater flow in the Valles Marineris on Mars inferred from fault trace ridges". Nature Geoscience. 1 (3): 181–183. doi:10.1038/ngeo131. ISSN 1752-0908.
- ^ Philip, G. (2007-11-01). "Remote sensing data analysis for mapping active faults in the northwestern part of Kangra Valley, NW Himalaya, India". International Journal of Remote Sensing. 28 (21): 4745–4761. doi:10.1080/01431160701264243. ISSN 0143-1161. S2CID 129833739.
