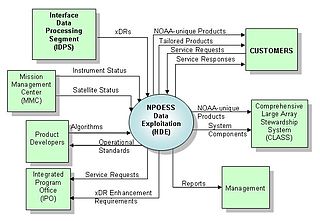
System context diagram

A System Context Diagram (SCD) in software engineering and systems engineering are diagrams that represent all external entities that may interact with a system.[2] This diagram is the highest level view of a system, similar to Block Diagram, showing a, possibly software-based, system as a whole and its inputs and outputs from/to external factors.
Overview
System Context Diagram are diagrams used in systems design to represent all external entities that may interact with a system. This diagram pictures the system at the center, with no details of its interior structure, surrounding by all its interacting systems, environment and activities. The objective of a system context diagram is to focus attention on external factors and events that should be considered in developing a complete set of system requirements and constrains.[2]
System context diagram are related to Data Flow Diagram, and show the interactions between a system and other actors with which the system is designed to face. System context diagrams can be helpful in understanding the context in which the system will be part of software engineering.
Context diagrams are used early in a project to get agreement on the scope under investigation. Context diagrams are typically included in a requirements document. These diagrams must be read by all project stakeholders and thus should be written in plain language, so the stakeholders can understand items within the document.
Building blocks
Context diagrams are typically drawn using:
- labeled boxes to represent each of the external entities and
- another labeled box to represent the system being developed.
- Relationship are drawn as a line between the entities and the system being developed.
- Relationships are labeled with a subject-verb-object format.
For example, "customer places order." Context diagrams can also use many different drawing types to represent external entities. They can use ovals, stick figures, pictures, clip art or any other representation to convey meaning. Decision trees and data storage are represented in system flow diagrams.
Alternatives
The best System Context Diagrams are used to display how system inter operates at a very high level or how systems operate and interact logically. The system context diagram is a necessary tool in developing a baseline interaction between systems and actors; actors and system or systems and systems.
An alternative would be a use case diagram since it also represents the scope of the project at a similar level of abstraction.
An other alterantive are enterprise data models. These data models can contain between 50 and 200 entitiy classes. They are achieved by employing a high level of generalization in data modeling.[3]
See also
- List of graphical methods
- Network diagram
- Requirements analysis
- Software development process
- Systems analysis
References
- ^ NDE Project Management (NPOESS) Data Exploitation web site. 2008.
- ^ a b Alexander Kossiakoff, William N. Sweet (2003). Systems Engineering: Principles and Practices p. 413.
- ^ Graeme C. Simsion, Graham C. Witt (2005). Data Modeling Essentials. p.512.
