User:FixCop/sandbox

From Wikipedia, the free encyclopedia

This is an old revision of this page, as edited by FixCop (talk | contribs) at 18:20, 29 September 2021. The present address (URL) is a permanent link to this revision, which may differ significantly from the current revision.

2021 United States federal election

← 2017 26 September 2021 (2021-09-26) Next →

All 735 seats in the House of Representatives, including 137 overhang and leveling seats
368 seats needed for a majority
Opinion polls
Turnout159,633,396 (66.8%) Increase 0.4 pp
  First party Second party Third party
 
Joe Biden presidential portrait.jpg
Mitt Romney official US Senate portrait.jpg
Elizabeth Warren, official portrait, 114th Congress.jpg
Candidate Joe Biden Mitt Romney Elizabeth Warren
Party Social Democrats CDU/CSU Greens
Leader since 20 August 2020[a] 21 May 2015 27 January 2018
Leader's seat Delaware-Wilmington (won) Utah-Salt Lake (list)[b] Massachusetts-Cambridge (list)
Last election 20.5%, 153 seats 32.9%, 246 seats 8.9%, 67 seats
Seats won 206 196 118
Seat change Increase 53 Decrease 50 Increase 51
Popular vote 41,025,782 38,471,648 23,625,742
Percentage 25.7% 24.1% 14.8%[c]
Swing Increase 5.2 pp Decrease 8.8 pp Increase 5.8 pp

  Fourth party Fifth party Sixth party
 
Pete Buttigieg official photo.jpg
Tucker Carlson 2020 (cropped).jpg
Alexandria Ocasio-Cortez Official Portrait.jpg
Candidate Pete Buttigieg Tucker Carlson Alexandria Ocasio-Cortez
Party Free Democratic American Alternative The Left
Leader since 7 December 2019 24 May 2021[e]
30 November 2019
27 February 2021
2 May 2021[f]
Leader's seat Indiana-South Bend (list)[d] Maine-Oxford (list) New York-Bronx (list)
Last election 10.7%, 80 seats 12.6%, 94 seats 9.2%, 69 seats
Seats won 92 83 39
Seat change Increase 12 Decrease 11 Decrease 30
Popular vote 18,357,840 16,442,239 7,822,036
Percentage 11.5% 10.3% 4.9%
Swing Increase 0.7 pp Decrease 2.3 pp Decrease 4.3 pp

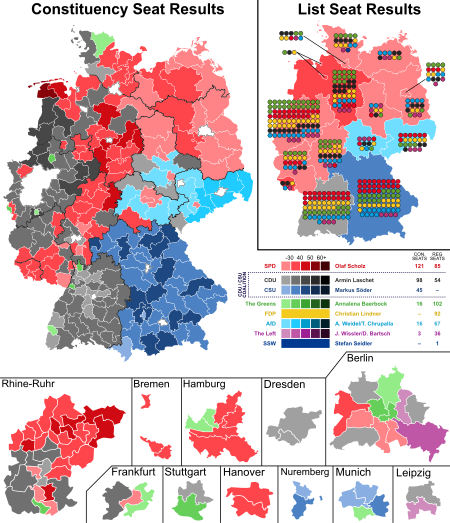
The left side shows constituency winners of the election by their party colours. The right side shows party list winners of the election for the additional members by their party colours.

Government before election

Fourth Merkel cabinet
CDU/CSUSPD

Government after election

TBD


2024 United States House of Representatives elections

← 2022 November 5, 2024 2026 →

All 435 seats in the United States House of Representatives
218 seats needed for a majority
Turnout63.32% (Increase 22.08%)
  Majority party Minority party Third party
 
Leader Nancy Pelosi Elise Stefanik Kurt Schrader
Party New Democrats Conservative Alliance
Leader since November 12, 2021 August 3, 2021 February 20, 2022
Leader's seat California New York Oregon
Seats won
Percentage 22.4% 19.8% 12.6%

  Fourth party Fifth party Sixth party
 
Leader Jim Banks Alexandria Ocasio-Cortez Adam Kinzinger
Party Nationalist Progressive America United
Leader since May 1, 2022 June 23, 2021 May 1, 2022
Leader's seat Indiana New York Illinois
Seats won
Percentage 10.5% 9.2% 5.7%
  1. ^ Scholz was nominated as the SPD's Chancellor candidate on 10 August 2020 but is not party leader.
  2. ^ Not the incumbent, but stood in this seat and won.
  3. ^ The Greens were disqualified from running on the Saarland state list due to irregularities in the selection of list candidates.[1]
  4. ^ Ran in Rheinisch-Bergischer Kreis (lost).
  5. ^ Weidel was elected co-lead candidate on 24 May 2021 but is not party co-leader.
  6. ^ Bartsch was announced as co-lead candidate on 2 May 2021 but is not party co-leader.
  1. ^ Anderson, Emma (5 August 2021). "German Greens must sit out vote in one state during national election". Politico. Retrieved 27 September 2021.