From Wikipedia, the free encyclopedia
The following tables show state-by-state results in the Australian House of Representatives at the 2010 federal election, Labor 72, Coalition 72, Nationals (WA) 1, Australian Greens 1, with 4 independents.[ 1] [ 2] [ 3] [ 4]
Australia
House of Representatives (IRV ) — Turnout 93.21% (CV ) — Informal 5.55%
Party
Votes
%
Swing
Seats
Change
Liberal
3,777,383
30.46
+0.76
44
Liberal National Party (QLD) [ a] 1,130,525
9.12
+0.60
21
National
419,286
3.43
−0.04
6
Country Liberal (NT)
38,335
0.31
−0.01
1
Coalition
5,365,529
43.32
+1.31
72
Australian Labor Party
4,711,363
37.99
−5.40
72
Australian Greens
1,458,998
11.76
+3.97
1
Independents
312,496
2.52
+0.30
4 [ b]
Family First Party
279,330
2.25
+0.26
Christian Democratic Party
83,009
0.67
−0.17
National (WA) [ c] 43,101
0.34
+0.20
1
One Nation
27,184
0.22
−0.04
Liberal Democratic Party
24,262
0.20
+0.06
Australian Democrats
22,376
0.18
−0.54
Secular Party of Australia
12,752
0.10
+0.10
Australian Sex Party
11,263
0.09
+0.09
Socialist Equality Party
11,160
0.09
+0.06
Socialist Alliance
9,348
0.08
+0.01
Citizens Electoral Council
8,017
0.06
−0.16
Democratic Labor Party
5,212
0.04
−0.01
The Climate Sceptics
4,339
0.03
+0.03
Australia First Party
3,670
0.03
+0.03
Non-Custodial Parents Party
2,835
0.02
+0.01
Building Australia Party
1,497
0.01
+0.01
Carers Alliance
1,458
0.01
+0.01
Communist Alliance
656
0.01
+0.01
Others
2,508
0.02
+0.01
Total
12,402,363
150
Two-party-preferred vote
Australian Labor Party
6,216,445
50.12
−2.58
72
Liberal/National Coalition
6,185,918
49.88
+2.58
72
Invalid/blank votes
729,304
5.55
+1.60
Registered voters/turnout
14,086,869
93.22
Source: Commonwealth Election 2010
Preference flows Greens − Labor 78.8% (-0.9) to Coalition 21.2% (+0.9)
Family First − Coalition 59.8% (-0.5) to Labor 40.2% (+0.5)
Christian Democrats − Coalition 73.5% (+3.9) to Labor 26.5% (-3.9)
Nationals WA − Coalition 75.9% (-5.1) to Labor 24.1% (+5.1)
Independent candidates − Coalition 56.5% (+1.9) to Labor 43.5% (-1.9)[ 5]
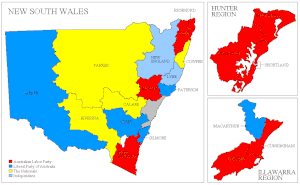
New South Wales
Electoral divisions: New South Wales Electoral divisions: Sydney area
Turnout 93.32% (CV ) — Informal 6.83%
Party
Votes
%
Swing
Seats
Change
Liberal
1,470,146
36.67
+4.04
16
National
317,867
7.93
+0.02
4
Coalition
1,788,013
44.60
+4.06
20
Australian Labor Party
1,494,490
37.28
−6.86
26
Australian Greens
410,405
10.24
+2.35
Independents
172,921
4.31
+1.00
2 [ b]
Christian Democratic Party
54,544
1.36
−0.56
One Nation
19,182
0.48
+0.27
Family First Party
17,453
0.44
−0.43
Australian Democrats
11,409
0.28
+0.01
Socialist Equality Party
9,106
0.23
+0.15
Liberal Democratic Party
8,928
0.22
+0.10
Secular Party of Australia
3,529
0.09
+0.09
Socialist Alliance
3,484
0.09
+0.03
Australia First Party
3,375
0.08
+0.08
Australian Sex Party
3,180
0.08
+0.08
Non-Custodial Parents Party
2,835
0.07
+0.05
Building Australia Party
1,497
0.04
+0.04
Carers Alliance
1,458
0.04
+0.04
Citizens Electoral Council
1,187
0.03
−0.19
Communist Alliance
656
0.02
+0.02
The Climate Sceptics
275
0.01
+0.01
Others
1,391
0.03
+0.01
Total
4,009,318
48
[ d]
Two-party-preferred vote
Australian Labor Party
1,958,077
48.84
–4.84
26
Liberal/National Coalition
2,051,241
51.16
+4.84
20
Invalid/blank votes
293,763
6.83
+1.88
Registered voters/turnout
4,610,795
93.33
Source: Commonwealth Election 2010
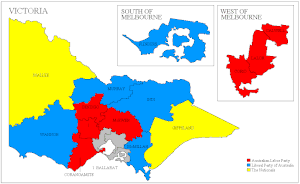
Victoria
Electoral divisions: Victoria Electoral divisions: Melbourne area
Turnout 93.46% (CV ) — Informal 4.50%
Party
Votes
%
Swing
Seats
Change
Australian Labor Party
1,361,416
42.81
–1.88
22
Liberal
1,159,301
36.45
–1.64
12
National
101,419
3.19
+0.17
2
Coalition
1,260,720
39.64
–1.47
14
Australian Greens
402,482
12.66
+4.49
1
Family First Party
99,747
3.14
+0.12
Independents
26,525
0.83
−0.17
Liberal Democratic Party
7,839
0.25
+0.15
Australian Sex Party
6,023
0.19
+0.19
Secular Party of Australia
5,239
0.16
+0.16
Australian Democrats
3,947
0.12
−1.10
Socialist Alliance
2,225
0.07
+0.00
Socialist Equality Party
1,656
0.05
+0.03
Citizens Electoral Council
922
0.03
−0.24
Christian Democratic Party
632
0.02
−0.02
Australia First Party
295
0.01
+0.01
Others
516
0.02
+0.00
Total
3,180,184
37
Two-party-preferred vote
Australian Labor Party
1,758,982
55.31
+1.04
22
Liberal/National Coalition
1,421,202
44.69
–1.04
14
Invalid/blank votes
149,699
4.50
+1.25
Registered voters/turnout
3,561,873
93.49
Source: Commonwealth Election 2010
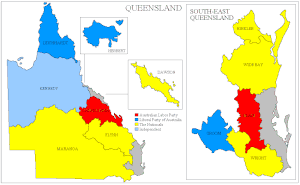
Queensland
Electoral divisions: Queensland Electoral divisions: Brisbane area
Turnout 92.71% (CV ) — Informal 5.45%
Party
Votes
%
Swing
Seats
Change
Liberal National Party
1,130,525
47.42
+2.95
21
Australian Labor Party
800,712
33.58
–9.33
8
Australian Greens
260,471
10.92
+5.29
Family First Party
92,794
3.89
+1.62
Independents
83,310
3.49
+0.50
1 [ b]
Liberal Democratic Party
4,662
0.20
+0.05
Democratic Labor Party
4,590
0.19
+0.19
One Nation
3,921
0.16
−0.20
Citizens Electoral Council
1,462
0.06
−0.09
Socialist Alliance
717
0.03
−0.02
Secular Party of Australia
414
0.02
+0.02
Others
601
0.03
+0.03
Total
2,384,179
30
1 [ e]
Two-party-preferred vote
Liberal National Party
1,314,675
55.14
+5.58
21
Australian Labor Party
1,069,504
44.86
–5.58
8
Invalid/blank votes
137,395
5.45
+1.89
Registered voters/turnout
2,719,360
92.73
Source: Commonwealth Election 2010
Western Australia
Electoral divisions: Western Australia
Turnout 92.86% (CV ) — Informal 4.82%
Party
Votes
%
Swing
Seats
Change
Liberal
566,145
47.02
+0.71
11
Labor
375,381
31.18
–5.62
3
Greens
158,117
13.13
+4.20
National [ c] 43,101
3.58
+2.44
1
Christian Democrats
27,833
2.31
+0.20
Family First
20,698
1.72
+0.51
Independents
5,079
0.42
–1.27
Sex Party
2,060
0.17
+0.17
One Nation
1,471
0.12
−1.03
Socialist Alliance
1,280
0.11
+0.01
Citizens Electoral Council
1,277
0.11
−0.15
Democratic Labour
622
0.05
+0.05
Climate Sceptics
539
0.04
+0.04
Socialist Equality
398
0.03
+0.02
Total
1,204,001
15
Two-party-preferred vote
Liberal
679,140
56.41
+3.15
11
Labor
524,861
43.59
–3.15
3
Invalid/blank votes
60,967
4.82
+0.97
Registered voters/turnout
1,362,534
92.84
Source: Commonwealth Election 2010
South Australia
Electoral divisions: South Australia
Turnout 93.80% (CV ) — Informal 5.46%
Party
Votes
%
Swing
Seats
Change
Australian Labor Party
399,279
40.74
–2.44
6
Liberal
394,003
40.21
–1.55
5
Australian Greens
117,364
11.98
+5.03
Family First Party
48,638
4.96
+0.91
Australian Democrats
7,020
0.72
−0.79
Independents
5,086
0.52
–0.18
The Climate Sceptics
3,525
0.36
+0.36
Liberal Democratic Party
2,833
0.29
+0.12
One Nation
1,105
0.11
−0.06
Socialist Alliance
786
0.08
+0.08
Secular Party of Australia
310
0.03
+0.03
Total
979,949
11
Two-party-preferred vote
Australian Labor Party
521,115
53.18
+0.78
6
Liberal
458,834
46.82
–0.78
5
Invalid/blank votes
56,565
5.46
+1.68
Registered voters/turnout
1,104,698
93.83
Source: Commonwealth Election 2010
Tasmania
Electoral divisions: Tasmania
Turnout 95.08% (CV ) — Informal 4.04%
Party
Votes
%
Swing
Seats
Change
Australian Labor Party
143,796
43.95
+1.18
4
Liberal
109,908
33.60
–4.62
0
Australian Greens
55,042
16.82
+3.32
Independents
15,627
4.78
+2.56
1 [ b]
Secular Party of Australia
1,085
0.33
+0.33
Socialist Alliance
856
0.26
+0.00
Citizens Electoral Council
838
0.26
−0.31
Total
327,152
5
Two-party-preferred vote
Australian Labor Party
198,332
60.62
+4.41
4
Liberal
128,830
39.38
–4.41
0
Invalid/blank votes
13,791
4.04
+1.12
Registered voters/turnout
358,609
95.07
Source: Commonwealth Election 2010
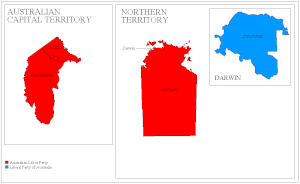
Territories
Electoral divisions: Territories
Australian Capital Territory
Northern Territory
House of Representatives (IRV ) — Turnout 82.71% (CV ) — Informal 6.19%
Party
Votes
%
Swing
Seats
Change
Country Liberal Party
38,335
40.83
–0.20
1
Australian Labor Party
35,589
37.91
–9.74
1
Australian Greens
12,175
12.97
+4.92
Independents
3,948
4.21
+1.55
Citizens Electoral Council
2,331
2.48
+2.23
One Nation
1,505
1.60
+1.60
Total
93,883
2
Two-party-preferred vote
Australian Labor Party
47,636
50.74
–4.67
1
Country Liberal Party
46,247
49.26
+4.67
1
Invalid/blank votes
6,198
6.19
+2.34
Registered voters/turnout
121,059
82.67
Source: Commonwealth Election 2010
See also
Notes
References
External links


