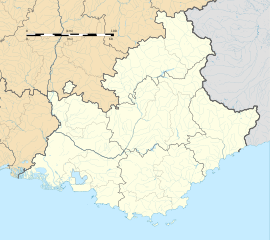
Saint-Cézaire-sur-Siagne
You can help expand this article with text translated from the corresponding article in French. (December 2008) Click [show] for important translation instructions.
|
Saint-Cézaire-sur-Siagne | |
|---|---|
 | |
| Coordinates: 43°38′59″N 6°47′37″E / 43.6497°N 6.7936°E | |
| Country | France |
| Region | Provence-Alpes-Côte d'Azur |
| Department | Alpes-Maritimes |
| Arrondissement | Grasse |
| Canton | Grasse-1 |
| Government | |
| • Mayor (2008–2014) | Maxime Coullet |
| Area 1 | 30.02 km2 (11.59 sq mi) |
| Population (2021)[1] | 3,924 |
| • Density | 130/km2 (340/sq mi) |
| Time zone | UTC+01:00 (CET) |
| • Summer (DST) | UTC+02:00 (CEST) |
| INSEE/Postal code | 06118 /06530 |
| Elevation | 95–771 m (312–2,530 ft) (avg. 500 m or 1,600 ft) |
| 1 French Land Register data, which excludes lakes, ponds, glaciers > 1 km2 (0.386 sq mi or 247 acres) and river estuaries. | |
Saint-Cézaire-sur-Siagne is a commune in the Alpes-Maritimes department in southeastern France.
Geography
Far from the major thoroughfares, Saint-Cézaire-sur-Siagne lies halfway between the beaches of the Côte d'Azur and the ski resorts of the Maritime Alps. It is located on a plateau at 475 m. Protected from north winds by the alpine foothills around Grasse, it enjoys an exceptionally tempered climate.
Saint-Cézaire-sur-Siagne is located at the extreme west end of Alpes-Maritimes, perched on a spur that dominates the valley of the Siagne.
Saint-Cézaire lies 15 km southwest of Grasse, 30 km from Cannes, and 52 km from Nice.
On the north are Escragnolles and Saint-Vallier-de-Thiey. To the south are Spéracèdes and Le Tignet. On the southwest are the valley of the Siagne and the massif of Tanneron, which forms the boundary between Alpes-Maritimes and the department of Var.
Population
| Year | Pop. | ±% |
|---|---|---|
| 1794 | 1,099 | — |
| 1806 | 1,086 | −1.2% |
| 1820 | 1,332 | +22.7% |
| 1831 | 1,216 | −8.7% |
| 1841 | 1,098 | −9.7% |
| 1851 | 1,486 | +35.3% |
| 1861 | 1,417 | −4.6% |
| 1872 | 1,399 | −1.3% |
| 1876 | 1,319 | −5.7% |
| 1881 | 1,296 | −1.7% |
| 1886 | 1,227 | −5.3% |
| 1891 | 1,286 | +4.8% |
| 1896 | 1,208 | −6.1% |
| 1901 | 1,207 | −0.1% |
| 1906 | 1,240 | +2.7% |
| 1911 | 1,043 | −15.9% |
| 1921 | 754 | −27.7% |
| 1926 | 680 | −9.8% |
| 1931 | 830 | +22.1% |
| 1936 | 689 | −17.0% |
| 1946 | 669 | −2.9% |
| 1954 | 677 | +1.2% |
| 1962 | 715 | +5.6% |
| 1968 | 809 | +13.1% |
| 1975 | 1,046 | +29.3% |
| 1982 | 1,578 | +50.9% |
| 1990 | 2,182 | +38.3% |
| 1999 | 2,840 | +30.2% |
| 2008 | 3,575 | +25.9% |
See also
References
- ^ "Populations légales 2021" (in French). The National Institute of Statistics and Economic Studies. 28 December 2023.


