1956 Dutch general election
Appearance
| |||||||||||||||||||||||||||||||||||||||||||||||||||||||||||||||||||||||||||||||||||||||||||||||||||||||||||||||||||||||
All 150 seats to the House of Representatives 76 seats were needed for a majority | |||||||||||||||||||||||||||||||||||||||||||||||||||||||||||||||||||||||||||||||||||||||||||||||||||||||||||||||||||||||
|---|---|---|---|---|---|---|---|---|---|---|---|---|---|---|---|---|---|---|---|---|---|---|---|---|---|---|---|---|---|---|---|---|---|---|---|---|---|---|---|---|---|---|---|---|---|---|---|---|---|---|---|---|---|---|---|---|---|---|---|---|---|---|---|---|---|---|---|---|---|---|---|---|---|---|---|---|---|---|---|---|---|---|---|---|---|---|---|---|---|---|---|---|---|---|---|---|---|---|---|---|---|---|---|---|---|---|---|---|---|---|---|---|---|---|---|---|---|---|---|
| Turnout | 95.5% | ||||||||||||||||||||||||||||||||||||||||||||||||||||||||||||||||||||||||||||||||||||||||||||||||||||||||||||||||||||||
| |||||||||||||||||||||||||||||||||||||||||||||||||||||||||||||||||||||||||||||||||||||||||||||||||||||||||||||||||||||||
 Seats | |||||||||||||||||||||||||||||||||||||||||||||||||||||||||||||||||||||||||||||||||||||||||||||||||||||||||||||||||||||||
| |||||||||||||||||||||||||||||||||||||||||||||||||||||||||||||||||||||||||||||||||||||||||||||||||||||||||||||||||||||||
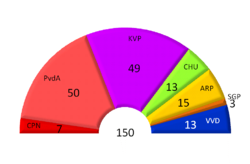
General elections were held in the Netherlands on 13 June 1956.[1] For the first time, the Labour Party emerged as the largest party, winning 50 of the 150 seats in the House of Representatives.[2]
Electoral system
Prior to the elections the number of seats in the House of Representatives was raised from 100 to 150.[3] This meant that the electoral threshold was reduced from 1% to 0.67%.[3]
Results
| Party | Votes | % | Seats | +/– |
|---|---|---|---|---|
| Labour Party | 1,872,209 | 32.7 | 50 | +20 |
| Catholic People's Party | 1,815,310 | 31.7 | 49 | +19 |
| Anti Revolutionary Party | 567,535 | 9.9 | 15 | +3 |
| People's Party for Freedom and Democracy | 502,530 | 8.8 | 13 | +4 |
| Christian Historical Union | 482,918 | 8.4 | 13 | +4 |
| Communist Party of the Netherlands | 272,054 | 4.7 | 7 | +1 |
| Reformed Political Party | 129,517 | 2.3 | 3 | +1 |
| Reformed Political League | 85,669 | 1.6 | 0 | 0 |
| National Union | 0 | New | ||
| National Opposition Union | 0 | New | ||
| Invalid/blank votes | 121,910 | – | – | – |
| Total | 5,849,652 | 100 | 150 | +50 |
| Registered voters/turnout | 6,152,210 | 95.5 | – | – |
| Source: Nohlen & Stöver | ||||


