
Venn diagram: Difference between revisions
m Reverted edits by 210.4.96.73 (talk) to last revision by Plantperson (HG) |
|||
| Line 39: | Line 39: | ||
Venn diagrams are similar to [[Euler diagram]]s. However, a Venn diagram for ''n'' component sets must contain all 2<sup>''n''</sup> hypothetically possible zones that correspond to some combination of inclusion or exclusion in each of the component sets. Euler diagrams contain only the actual possible zones for a particular given context. In Venn diagrams, a shaded zone may represent an empty zone, whereas in an Euler diagram the corresponding zone is missing from the diagram. For example, if one set represents ''dairy products'' and another ''cheeses'', the Venn diagram contains a zone for cheeses that are not dairy products. Assuming that in the context ''cheese'' means some type of dairy product, the Euler diagram has the cheese zone entirely contained within the dairy-product zone—there is no zone for (non-existent) non-dairy cheese. This means that as the number of contours increases, Euler diagrams are typically less visually complex than the equivalent Venn diagram, particularly if the number of non-empty intersections is small.<ref>{{cite web|title=Euler Diagrams 2004: Brighton, UK: September 22–23|url=http://www.cs.kent.ac.uk/events/conf/2004/euler/eulerdiagrams.html|year=2004|publisher=Reasoning with Diagrams project, University of Kent|accessdate=13 August 2008}}</ref> |
Venn diagrams are similar to [[Euler diagram]]s. However, a Venn diagram for ''n'' component sets must contain all 2<sup>''n''</sup> hypothetically possible zones that correspond to some combination of inclusion or exclusion in each of the component sets. Euler diagrams contain only the actual possible zones for a particular given context. In Venn diagrams, a shaded zone may represent an empty zone, whereas in an Euler diagram the corresponding zone is missing from the diagram. For example, if one set represents ''dairy products'' and another ''cheeses'', the Venn diagram contains a zone for cheeses that are not dairy products. Assuming that in the context ''cheese'' means some type of dairy product, the Euler diagram has the cheese zone entirely contained within the dairy-product zone—there is no zone for (non-existent) non-dairy cheese. This means that as the number of contours increases, Euler diagrams are typically less visually complex than the equivalent Venn diagram, particularly if the number of non-empty intersections is small.<ref>{{cite web|title=Euler Diagrams 2004: Brighton, UK: September 22–23|url=http://www.cs.kent.ac.uk/events/conf/2004/euler/eulerdiagrams.html|year=2004|publisher=Reasoning with Diagrams project, University of Kent|accessdate=13 August 2008}}</ref> |
||
FVCK YOU |
|||
==Extensions to higher numbers of sets== |
|||
Venn diagrams typically represent two or three sets, but there are forms that allow for higher numbers. Shown below, four intersecting spheres form the highest order Venn diagram that is completely symmetric and can be visually represented. The 16 intersections correspond to the vertices of a [[tesseract]] (or the cells of a [[16-cell]] respectively). |
|||
{|class="wikitable" style="text-align:center; width: 100%;" |
|||
| style="vertical-align:top;"|[[File:Venn 1000 0000 0000 0000.png|150px]] |
|||
| style="vertical-align:top;"|[[File:Venn 0110 1000 1000 0000.png|150px]]<br /> |
|||
[[File:Venn 0100 0000 0000 0000.png|37px]][[File:Venn 0010 0000 0000 0000.png|37px]][[File:Venn 0000 1000 0000 0000.png|37px]][[File:Venn 0000 0000 1000 0000.png|37px]] |
|||
| style="vertical-align:top;"|[[File:Venn 0001 0110 0110 1000.png|150px]]<br /> |
|||
[[File:Venn 0001 0000 0000 0000.png|24px]][[File:Venn 0000 0100 0000 0000.png|24px]][[File:Venn 0000 0010 0000 0000.png|24px]][[File:Venn 0000 0000 0100 0000.png|24px]][[File:Venn 0000 0000 0010 0000.png|24px]][[File:Venn 0000 0000 0000 1000.png|24px]] |
|||
| style="vertical-align:top;"|[[File:Venn 0000 0001 0001 0110.png|150px]]<br /> |
|||
[[File:Venn 0000 0001 0000 0000.png|37px]][[File:Venn 0000 0000 0001 0000.png|37px]][[File:Venn 0000 0000 0000 0100.png|37px]][[File:Venn 0000 0000 0000 0010.png|37px]] |
|||
| style="vertical-align:top;"|[[File:Venn 0000 0000 0000 0001.png|150px]] |
|||
|} |
|||
For higher numbers of sets, some loss of symmetry in the diagrams is unavoidable. Venn was keen to find "symmetrical figures…elegant in themselves,"<ref name="Venn1881">{{cite book|author=Jo Venn|title=Symbolic logic|url=http://books.google.com/books?id=nisCAAAAQAAJ&pg=PA108|accessdate=9 April 2013|year=1881|publisher=Macmillan|page=108}}</ref> that represented higher numbers of sets, and he devised a four-set diagram using [[ellipse]]s (see below). He also gave a construction for Venn diagrams for ''any'' number of sets, where each successive curve that delimits a set interleaves with previous curves, starting with the three-circle diagram. |
|||
<gallery widths=200px><!---perrow=3--> |
|||
Image:Venn4.svg|Venn's construction for 4 sets |
|||
Image:Venn5.svg|Venn's construction for 5 sets |
|||
Image:Venn6.svg|Venn's construction for 6 sets |
|||
Image:Venn's four ellipse construction.svg|Venn's four-set diagram using ellipses |
|||
Image:CirclesN4xb.svg|'''Counter-example:''' This [[Euler diagram]] is '''not''' a Venn diagram for four sets as it has only 13 regions (excluding the outside); there is no region where only the yellow and blue, or only the pink and green circles meet. |
|||
File:Symmetrical 5-set Venn diagram.svg|Five-set Venn diagram using congruent ellipses in a radially symmetrical arrangement devised by [[Branko Grünbaum]]. Labels have been simplified for greater readability; for example, '''A''' denotes '''A''' ∩ '''B'''<sup>c</sup> ∩ '''C'''<sup>c</sup> ∩ '''D'''<sup>c</sup> ∩ '''E'''<sup>c</sup>, while '''BCE''' denotes '''A'''<sup>c</sup> ∩ '''B''' ∩ '''C''' ∩ '''D'''<sup>c</sup> ∩ '''E'''. |
|||
File:6-set_Venn_diagram.svg|Six-set Venn diagram made of only triangles. |
|||
</gallery> |
|||
===Edwards' Venn diagrams=== |
|||
<gallery widths=150px> |
|||
Image:Venn-three.svg| Three sets |
|||
Image:Edwards-Venn-four.svg| Four sets |
|||
Image:Edwards-Venn-five.svg| Five sets |
|||
Image:Edwards-Venn-six.svg| Six sets |
|||
</gallery> |
|||
[[A. W. F. Edwards]] constructed a series of Venn diagrams for higher numbers of sets by segmenting the surface of a sphere. For example, three sets can be easily represented by taking three hemispheres of the sphere at right angles (''x'' = 0, ''y'' = 0 and ''z'' = 0). A fourth set can be added to the representation by taking a curve similar to the seam on a tennis ball, which winds up and down around the equator, and so on. The resulting sets can then be projected back to a plane to give ''cogwheel'' diagrams with increasing numbers of teeth, as shown on the right. These diagrams were devised while designing a [[stained-glass]] window in memory of Venn. |
|||
===Other diagrams=== |
|||
Edwards' Venn diagrams are [[Topological equivalence|topologically equivalent]] to diagrams devised by [[Branko Grünbaum]], which were based around intersecting [[polygon]]s with increasing numbers of sides. They are also 2-dimensional representations of [[hypercube]]s. |
|||
Smith{{Citation needed|date=January 2012}} devised similar ''n''-set diagrams using [[sine]] curves with the series of equations |
|||
: <math>y_i = \frac {\sin(2^{i }x)}{2 i} \text{ where } 0 \leq i \leq n-2 \text{ and } i \in \mathbb{N}. </math> |
|||
[[Lewis Carroll|Charles Lutwidge Dodgson]] devised a five-set diagram. |
|||
==Related concepts== |
==Related concepts== |
||
Revision as of 11:19, 26 June 2013

| Part of a series on statistics |
| Probability theory |
|---|
 |
A Venn diagram or set diagram is a diagram that shows all possible logical relations between a finite collection of sets. Venn diagrams were conceived around 1880 by John Venn. They are used to teach elementary set theory, as well as illustrate simple set relationships in probability, logic, statistics, linguistics and computer science.
Example
This example involves two sets, A and B, represented here as coloured circles. The orange circle, set A, represents all living creatures that are two-legged. The blue circle, set B, represents the living creatures that can fly. Each separate type of creature can be imagined as a point somewhere in the diagram. Living creatures that both can fly and have two legs—for example, parrots—are then in both sets, so they correspond to points in the area where the blue and orange circles overlap. That area contains all such and only such living creatures.
Humans and penguins are bipedal, and so are then in the orange circle, but since they cannot fly they appear in the left part of the orange circle, where it does not overlap with the blue circle. Mosquitoes have six legs, and fly, so the point for mosquitoes is in the part of the blue circle that does not overlap with the orange one. Creatures that are not two-legged and cannot fly (for example, whales and spiders) would all be represented by points outside both circles.
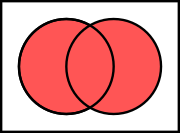
The combined area of sets A and B is called the union of A and B, denoted by A ∪ B. The union in this case contains all living creatures that are either two-legged or that can fly (or both).
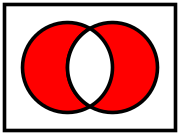
The area in both A and B, where the two sets overlap, is called the intersection of A and B, denoted by A ∩ B. For example, the intersection of the two sets is not empty, because there are points that represent creatures that are in both the orange and blue circles.
History
Venn diagrams were introduced in 1880 by John Venn (1834–1923) in a paper entitled On the Diagrammatic and Mechanical Representation of Propositions and Reasonings in the "Philosophical Magazine and Journal of Science", about the different ways to represent propositions by diagrams.[1] The use of these types of diagrams in formal logic, according to Ruskey and M. Weston, is "not an easy history to trace, but it is certain that the diagrams that are popularly associated with Venn, in fact, originated much earlier. They are rightly associated with Venn, however, because he comprehensively surveyed and formalized their usage, and was the first to generalize them".[2]
Venn himself did not use the term "Venn diagram" and referred to his invention as "Eulerian Circles."[1] For example, in the opening sentence of his 1880 article Venn writes, "Schemes of diagrammatic representation have been so familiarly introduced into logical treatises during the last century or so, that many readers, even those who have made no professional study of logic, may be supposed to be acquainted with the general nature and object of such devices. Of these schemes one only, viz. that commonly called 'Eulerian circles,' has met with any general acceptance..."[3] The first to use the term "Venn diagram" was Clarence Irving Lewis in 1918, in his book "A Survey of Symbolic Logic".[2]
Venn diagrams are very similar to Euler diagrams, which were invented by Leonhard Euler (1708–1783) in the 18th century.[note 1] M. E. Baron has noted that Leibniz (1646–1716) in the 17th century produced similar diagrams before Euler, but much of it was unpublished. She also observes even earlier Euler-like diagrams by Ramon Lull in the 13th Century.[4]
In the 20th century, Venn diagrams were further developed. D.W. Henderson showed in 1963 that the existence of an n-Venn diagram with n-fold rotational symmetry implied that n was a prime number.[5] He also showed that such symmetric Venn diagrams exist when n is 5 or 7. In 2002 Peter Hamburger found symmetric Venn diagrams for n = 11 and in 2003, Griggs, Killian, and Savage showed that symmetric Venn diagrams exist for all other primes. Thus rotationally symmetric Venn diagrams exist if and only if n is a prime number.[6]
Venn diagrams and Euler diagrams were incorporated as part of instruction in set theory as part of the new math movement in the 1960s. Since then, they have also been adopted by other curriculum fields such as reading.[7]
Overview
-
-
-
-
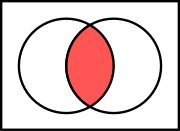
 Symmetric difference of two sets
 -
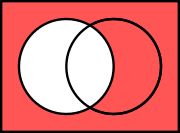


A Venn diagram is constructed with a collection of simple closed curves drawn in a plane. According to Lewis,[8] the "principle of these diagrams is that classes [or sets] be represented by regions in such relation to one another that all the possible logical relations of these classes can be indicated in the same diagram. That is, the diagram initially leaves room for any possible relation of the classes, and the actual or given relation, can then be specified by indicating that some particular region is null or is not-null".[8]: 157
Venn diagrams normally comprise overlapping circles. The interior of the circle symbolically represents the elements of the set, while the exterior represents elements that are not members of the set. For instance, in a two-set Venn diagram, one circle may represent the group of all wooden objects, while another circle may represent the set of all tables. The overlapping area or intersection would then represent the set of all wooden tables. Shapes other than circles can be employed as shown below by Venn's own higher set diagrams. Venn diagrams do not generally contain information on the relative or absolute sizes (cardinality) of sets; i.e. they are schematic diagrams.
Venn diagrams are similar to Euler diagrams. However, a Venn diagram for n component sets must contain all 2n hypothetically possible zones that correspond to some combination of inclusion or exclusion in each of the component sets. Euler diagrams contain only the actual possible zones for a particular given context. In Venn diagrams, a shaded zone may represent an empty zone, whereas in an Euler diagram the corresponding zone is missing from the diagram. For example, if one set represents dairy products and another cheeses, the Venn diagram contains a zone for cheeses that are not dairy products. Assuming that in the context cheese means some type of dairy product, the Euler diagram has the cheese zone entirely contained within the dairy-product zone—there is no zone for (non-existent) non-dairy cheese. This means that as the number of contours increases, Euler diagrams are typically less visually complex than the equivalent Venn diagram, particularly if the number of non-empty intersections is small.[9]
FVCK YOU
Related concepts

Venn diagrams correspond to truth tables for the propositions , , etc., in the sense that each region of Venn diagram corresponds to one row of the truth table.[10][11] Another way of representing sets is with R-Diagrams.


See also
Notes
- ^ In Euler's Letters to a German Princess. In Venn's article, however, he suggests that the diagrammatic idea predates Euler, and is attributable to C. Weise or J. C. Lange.
References
- ^ a b Sandifer, Ed (2003). "How Euler Did It" (pdf). The Mathematical Association of America: MAA Online. Retrieved 26 October 2009.
- ^ a b Ruskey, F.; Weston, M. (June 2005). "Venn Diagram Survey". The electronic journal of combinatorics.
{{cite journal}}: CS1 maint: multiple names: authors list (link) - ^ Venn, J. (July 1880). "On the Diagrammatic and Mechanical Representation of Propositions and Reasonings". Philosophical Magazine and Journal of Science. 5. 10 (59).
- ^ Baron, M.E. (May 1969). "A Note on The Historical Development of Logic Diagrams". The Mathematical Gazette. 53 (384): 113–125. JSTOR 3614533.
- ^ Henderson, D.W. (April 1963). "Venn diagrams for more than four classes". American Mathematical Monthly. 70 (4): 424–6. JSTOR 2311865.
- ^ Ruskey, Frank; Savage, Carla D.; Wagon, Stan (2006). "The Search for Simple Symmetric Venn Diagrams" (PDF). Notices of the AMS. 53 (11): 1304–11.
{{cite journal}}: Unknown parameter|month=ignored (help) - ^ Strategies for Reading Comprehension Venn Diagrams
- ^ a b Lewis, Clarence Irving (1918). A Survey of Symbolic Logic. Berkeley: University of California Press.
- ^ "Euler Diagrams 2004: Brighton, UK: September 22–23". Reasoning with Diagrams project, University of Kent. 2004. Retrieved 13 August 2008.
- ^ Grimaldi, Ralph P. (2004). Discrete and combinatorial mathematics. Boston: Addison-Wesley. p. 143. ISBN 0-201-72634-3.
- ^ Johnson, D. L. (2001). "3.3 Laws". Elements of logic via numbers and sets. Springer Undergraduate Mathematics Series. Berlin: Springer-Verlag. p. 62. ISBN 3-540-76123-3.
{{cite book}}: External link in|chapterurl=|chapterurl=ignored (|chapter-url=suggested) (help)
Further reading
- A Survey of Venn Diagrams by F. Ruskey and M. Weston, is an extensive site with much recent research and many beautiful figures.
- Stewart, Ian (2004). "Ch. 4 Cogwheels of the Mind". Another Fine Math You've Got Me Into. Dover Publications. pp. 51–64. ISBN 0-486-43181-9.
{{cite book}}: External link in|chapterurl=|chapterurl=ignored (|chapter-url=suggested) (help) - Edwards, A.W.F. (2004). Cogwheels of the mind: the story of Venn diagrams. JHU Press. ISBN 978-0-8018-7434-5.
- Venn, John (1880). "On the Diagrammatic and Mechanical Representation of Propositions and Reasonings". Dublin Philosophical Magazine and Journal of Science. 9 (59): 1–18.
- Mamakani, Khalegh; Ruskey, Frank (27 July 2012), A New Rose : The First Simple Symmetric 11-Venn Diagram, arXiv:1207.6452
External links
- "Venn diagram", Encyclopedia of Mathematics, EMS Press, 2001 [1994]
- Weisstein, Eric W. "Venn Diagram". MathWorld.
- Lewis Carroll's Logic Game — Venn vs. Euler at cut-the-knot
- A Survey of Venn Diagrams
- Area proportional 3-way venn diagram applet
- Generating Venn Diagrams to explore Google Suggest results
- seven sets interactive Venn diagram displaying color combinations
- six sets Venn diagrams made from triangles
- Postscript for 9-set Venn and more
- VBVenn--A Visual Basic program for calculating and graphing quantitative two-circle Venn diagrams
| Major fields |
| ||||
|---|---|---|---|---|---|
| Foundations | |||||
| Lists |
| ||||
| Overview |  | |
|---|---|---|
| Axioms | ||
| Operations |
| |
| ||
| Set types | ||
| Theories | ||
| ||
| Set theorists | ||