East Antarctic Ice Sheet: Difference between revisions
Added a section on the ice sheet's formation and history. Expanded the lead to better reflect the entire article. |
Created a description section, using some material from the East Antarctic Shield article to do so (see its page history for attribution). Updated the paragraphs on warming/ice loss and the Wilkes Basin. Standardized layout a bit more (coordinates were in the wrong place, etc.) Added more images. |
||
| Line 1: | Line 1: | ||
{{Short description|Segment of the continental ice sheet that covers East Antarctica}} |
{{Short description|Segment of the continental ice sheet that covers East Antarctica}} |
||
| ⚫ | |||
{{Infobox glacier |
{{Infobox glacier |
||
|name=East Antarctic ice sheet |
|name=East Antarctic ice sheet |
||
|photo=File: |
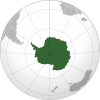
|photo=File:Antarctica.svg |
||
|photo_width=300 |
|photo_width=300 |
||
|thickness=~{{convert|2|km|mi|1|abbr=on}} (average), ~{{convert|4. |
|thickness=~{{convert|2.2|km|mi|1|abbr=on}} (average)<ref name="Torsvik2008" />, ~{{convert|4.9|km|mi|1|abbr=on}} (maximum) <ref name="Fretwell2013" /> |
||
|type=[[Ice sheet]] |
|type=[[Ice sheet]] |
||
}} |
}} |
||
The '''East Antarctic Ice Sheet''' ('''EAIS''') lies between [[45th meridian west|45° west]] and [[168th meridian east|168° east]] longitudinally. It was first formed around 34 million years ago, and it is the largest [[ice sheet]] on the entire planet, with far greater volume than the [[Greenland ice sheet]] or the [[West Antarctic Ice Sheet]] (WAIS), from which it is separated by the [[Transantarctic Mountains]]. The ice sheet is |
The '''East Antarctic Ice Sheet''' ('''EAIS''') lies between [[45th meridian west|45° west]] and [[168th meridian east|168° east]] longitudinally. It was first formed around 34 million years ago,<ref name="Galeotti2016" /> and it is the largest [[ice sheet]] on the entire planet, with far greater volume than the [[Greenland ice sheet]] or the [[West Antarctic Ice Sheet]] (WAIS), from which it is separated by the [[Transantarctic Mountains]]. The ice sheet is around {{Convert|2.2|km|mi|abbr=on}} thick on average and is {{Convert|4897|m|ft|abbr=on}} at its thickest point.<ref name="Fretwell2013" /> It is also home to the geographic [[South Pole]] and the [[Amundsen–Scott South Pole Station]]. |
||
The surface of the EAIS is the driest, windiest, and coldest place on Earth. Lack of moisture in the air, high [[albedo]] from the snow as well as the surface's consistently high elevation<ref name="Singh2020" /> results in the reported cold temperature records of nearly −{{cvt|100|C|F}}.<ref |
The surface of the EAIS is the driest, windiest, and coldest place on Earth. Lack of moisture in the air, high [[albedo]] from the snow as well as the surface's consistently high elevation<ref name="Singh2020" /> results in the reported cold temperature records of nearly −{{cvt|100|C|F}}.<ref name="Scambos2018" /><ref name="VizcarraNSIDC2018" /> Because of that, it has been practically the only place on Earth to have experienced little-to-no [[climate change|warming]] caused by [[greenhouse gas emissions]] in the recent years.<ref name="Singh2020" /> |
||
The East Antarctic ice sheet is most likely to first see sustained losses of ice at its most vulnerable locations such as [[Totten Glacier]] and [[Wilkes Basin]]. Those areas are sometimes collectively described as East Antarctica's subglacial basins, and it is believed that once the warming reaches around {{convert|3|C-change|F-change}}, then they would start to collapse over a period of around 2,000 years,<ref name="ArmstrongMcKay2022" /><ref name="ArmstrongMcKayExplainer" /> This collapse would ultimately add between {{convert|1.4|m|ftin|abbr=on}} and {{convert|6.4|m|ftin|abbr=on}} to sea levels, depending on the [[ice sheet model]] used.<ref name="Pan2021" |
The East Antarctic ice sheet is most likely to first see sustained losses of ice at its most vulnerable locations such as [[Totten Glacier]] and [[Wilkes Basin]]. Those areas are sometimes collectively described as East Antarctica's subglacial basins, and it is believed that once the warming reaches around {{convert|3|C-change|F-change}}, then they would start to collapse over a period of around 2,000 years,<ref name="ArmstrongMcKay2022" /><ref name="ArmstrongMcKayExplainer" /> This collapse would ultimately add between {{convert|1.4|m|ftin|abbr=on}} and {{convert|6.4|m|ftin|abbr=on}} to sea levels, depending on the [[ice sheet model]] used.<ref name="Pan2021" /> The EAIS as a whole holds enough ice to raise global sea levels by {{Convert|53.3|m|ft|abbr=on}}.<ref name="Fretwell2013" /> However, it would take global warming in a range between {{convert|5|C-change|F-change}} and {{convert|10|C-change|F-change}}, and a minimum of 10,000 years for the entire ice sheet to be lost.<ref name="ArmstrongMcKay2022" /><ref name="ArmstrongMcKayExplainer" /> |
||
== Description == |
|||
[[File:Lake_Vostok_drill_2011.jpg|thumb|Location and diagram of [[Lake Vostok]], a prominent subglacial lake beneath the East Antarctic Ice Sheet.]] |
|||
East Antarctic Ice Sheet is located directly above the [[East Antarctic Shield]] - a [[craton]] (stable area of the [[Earth's crust]]) with the area of {{cvt|10,200,000|sqkm|sqmi}}, which accounts for around 73% of the entire Antarctic landmass.<ref name="Drewry1976">{{cite journal|last=Drewry|first=David J.|title=Sedimentary basins of the east antarctic craton from geophysical evidence|journal=Tectonophysics|date=November 1976|volume=36|issue=1–3|pages=301–314|bibcode=1976Tectp..36..301J|doi=10.1016/0040-1951(76)90023-8}}</ref> [[East Antarctica]] is separate from [[West Antarctica]] due to the presence of [[Transantarctic Mountains]], which span nearly {{cvt|3,500|km|mi}} from the [[Weddell Sea]] to the [[Ross Sea]], and have a width of {{cvt|100-300|km|mi}}.<ref name="Torsvik2008">{{cite book|last1=Torsvik|first1=T. H.|first2=C. |last2=Gaina |first3=T. F. |last3=Redfield|chapter=Antarctica and Global Paleogeography: From Rodinia, Through Gondwanaland and Pangea, to the Birth of the Southern Ocean and the Opening of Gateways|title=Antarctica: A Keystone in a Changing World|year=2008|pages=125–140|chapter-url=http://www.nap.edu/openbook.php?record_id=12168&page=125|doi=10.17226/12168|isbn=978-0-309-11854-5}}</ref> |
|||
The ice sheet has an average thickness of around {{Convert|2.2|km|mi|abbr=on}}. The thickest ice in Antarctica is located near [[Adelie Land]] close to the ice sheet's southeast coast, at the [[Astrolabe Subglacial Basin]], where it measured {{Convert|4897|m|ft|abbr=on}} around 2013.<ref name="Torsvik2008" /><ref name="Fretwell2013">{{Cite journal|last1=Fretwell|first1=P.|last2=Pritchard|first2=H. D.|last3=Vaughan|first3=D. G.|last4=Bamber|first4=J. L.|last5=Barrand|first5=N. E.|last6=Bell|first6=R.|last7=Bianchi|first7=C.|last8=Bingham|first8=R. G.|last9=Blankenship|first9=D. D.|date=2013-02-28|title=Bedmap2: improved ice bed, surface and thickness datasets for Antarctica|journal=The Cryosphere|volume=7|issue=1|pages=375–393|doi=10.5194/tc-7-375-2013|issn=1994-0424|doi-access=free|bibcode=2013TCry....7..375F|hdl=1808/18763|hdl-access=free}}</ref> Much of the ice sheet is already located at a high elevation: in particular, [[Dome Argus]] Plateau has an average height of around {{Convert|4|km|mi|abbr=on}}, and yet it is underlain by the [[Gamburtsev Mountain Range]], which has the average height of {{Convert|2.7|km|mi|abbr=on}} and is about equivalent in size to the European [[Alps]].<ref name= "PrattEARTH2012">{{cite web |author=Sara E. Pratt |date=6 February 2012 |title=Unearthing Antarctica's mysterious mountains |url=https://www.earthmagazine.org/article/unearthing-antarcticas-mysterious-mountains |publisher=[[Earth Magazine]] |accessdate=15 January 2024 }}</ref><ref name= "BellSciAm2008">{{cite web |author=Robin Bell |date=12 November 2008 |title=Dispatches from the Bottom of the Earth: An Antarctic Expedition in Search of Large Mountains Encased in Ice |url=https://www.scientificamerican.com/article/antarctic-expedition-in-search-of-lost-mountains/ |publisher=[[Scientific American]] |accessdate=15 January 2024 }}</ref> Consequently, the ice thickness over these mountains ranges from around {{Convert|1|km|mi|abbr=on}} over their peaks to about {{Convert|3|km|mi|abbr=on}} over the valleys.<ref name="EAISDavies">{{cite web |last=Davies |first=Bethan |title=East Antarctic Ice Sheet |url=https://www.antarcticglaciers.org/antarctica-2/east-antarctic-ice-sheet/ |website=AntarcticGlaciers.org |date=22 June 2020 }}</ref> |
|||
[[File:South_Pole_Dome_From_Station.JPG|thumb|left|[[South Pole]] research station.]] |
|||
These high elevations are an important reason for why the ice sheet is the driest, windiest, and coldest place on Earth. Dome A in particular sets reported cold temperature records of nearly −{{cvt|100|C|F}}.<ref name="Scambos2018">{{cite journal |last1=Scambos |first1=T. A. |last2=Campbell |first2=G. G. |last3=Pope |first3=A. |last4=Haran |first4=T. |last5=Muto |first5=A. |last6=Lazzara |first6=M. |last7=Reijmer |first7=C. H. |last8=Van Den Broeke |first8=M. R. |date=25 June 2018 |title=Ultralow Surface Temperatures in East Antarctica From Satellite Thermal Infrared Mapping: The Coldest Places on Earth |journal=Geophysical Research Letters |volume=45 |issue=12 |pages=6124–6133 |doi=10.1029/2018GL078133 |bibcode=2018GeoRL..45.6124S |hdl=1874/367883 |doi-access=free |hdl-access=free }}</ref><ref name="VizcarraNSIDC2018">{{Cite web |last=Vizcarra |first=Natasha |url=https://nsidc.org/news-analyses/news-stories/new-study-explains-antarcticas-coldest-temperatures |date=25 June 2018 |title=New study explains Antarctica's coldest temperatures |publisher=[[National Snow and Ice Data Center]] |language=en |access-date=10 January 2024 }}</ref><ref name="Singh2020">{{Cite journal |last1=Singh |first1=Hansi A. |last2=Polvani |first2=Lorenzo M. |date=10 January 2020 |title=Low Antarctic continental climate sensitivity due to high ice sheet orography |journal=npj Climate and Atmospheric Science |language=en |volume=3 |doi=10.1038/s41612-020-00143-w |s2cid=222179485 |doi-access=free }}</ref> The only ice-free areas of East Antarctica are where there is too little annual [[precipitation]] to form an ice layer, which is the case in the so-called Dry Valleys of the [[Southern Victoria Land]]. Another exception are the [[subglacial lake]]s, which occur so deep beneath the ice that the [[pressure melting point]] is well below {{cvt|0|C|F}}.<ref name="EAISDavies">{{cite web |last=Davies |first=Bethan |title=East Antarctic Ice Sheet |url=https://www.antarcticglaciers.org/antarctica-2/east-antarctic-ice-sheet/ |website=AntarcticGlaciers.org |date=22 June 2020 }}</ref> |
|||
| ⚫ | Many countries have made [[territorial claims in Antarctica]]. Within EAIS, the [[British Antarctic Territory|United Kingdom]], [[French Antarctic Territory|France]], [[Norwegian Antarctic territories|Norway]], [[Australian Antarctic Territory|Australia]], [[Chilean Antarctic Territory|Chile]] and [[Argentine Antarctica|Argentina]] all claim a portion (sometimes overlapping) as their own territory.<ref>{{Cite journal |last1=Bush |first1=W. M. |date=October 1989 |title=Antarctica and international law: a collection of inter-state and national documents |journal=American Journal of International Law |language=en |volume=83 |issue=4 |pages=959-964 |doi=10.2307/2203393 |isbn=978-0-379-20321-9 }}</ref> |
||
== Geologic history == |
== Geologic history == |
||
[[File:65 Myr Climate Change.png|thumb|upright=1.3|Polar climatic temperature changes throughout the [[Cenozoic]], showing [[glaciation]] of Antarctica toward the end of the [[Eocene]], thawing near the end of the [[Oligocene]] and subsequent [[Miocene]] re-glaciation.]] |
[[File:65 Myr Climate Change.png|thumb|upright=1.3|Polar climatic temperature changes throughout the [[Cenozoic]], showing [[glaciation]] of Antarctica toward the end of the [[Eocene]], thawing near the end of the [[Oligocene]] and subsequent [[Miocene]] re-glaciation.]] |
||
While relatively small [[glacier]]s and [[ice cap]]s are known to have been present in Antarctica since at least the time of Late [[Palaeocene]], 60 [[million years ago]],<ref name="Barr2022">{{cite journal |last1=Barr |first1=Iestyn D. |last2=Spagnolo |first2=Matteo |last3=Rea |first3=Brice R. |last4=Bingham |first4=Robert G. |last5=Oien |first5=Rachel P. |last6=Adamson |first6=Kathryn |last7=Ely |first7=Jeremy C. |last8=Mullan |first8=Donal J. |last9=Pellitero |first9=Ramón |last10=Tomkins |first10=Matt D. |title=60 million years of glaciation in the Transantarctic Mountains |journal=Nature Communications |date=21 September 2022 |volume=13 |issue=1 |pages=5526 |doi=10.1038/s41467-022-33310-z |language=en |issn=2041-1723|hdl=2164/19437 |hdl-access=free }}</ref> a proper ice sheet did not begin to form until the [[Eocene–Oligocene extinction event]] about 34 million years ago, when the atmospheric {{CO2}} levels fell to below 750 [[parts per million]]. It was initially unstable, and did not grow to consistently cover the entire continent until 32.8 million years ago, when the {{CO2}} levels had further declined to below 600 ppm.<ref>{{cite journal |last1=Galeotti |first1=Simone |last2=DeConto |first2=Robert |last3=Naish |first3=Timothy |last4=Stocchi |first4=Paolo |last5=Florindo |first5=Fabio |last6=Pagani |first6=Mark |last7=Barrett |first7=Peter |last8=Bohaty |first8=Steven M. |last9=Lanci |first9=Luca |last10=Pollard |first10=David |last11=Sandroni |first11=Sonia |last12=Talarico |first12=Franco M. |last13=Zachos |first13=James C. |title=Antarctic Ice Sheet variability across the Eocene-Oligocene boundary climate transition |journal=Science |date=10 March 2016 |volume=352 |issue=6281 |pages=76–80 |doi=10.1126/science.aab066 }}</ref> |
While relatively small [[glacier]]s and [[ice cap]]s are known to have been present in Antarctica since at least the time of Late [[Palaeocene]], 60 [[million years ago]],<ref name="Barr2022">{{cite journal |last1=Barr |first1=Iestyn D. |last2=Spagnolo |first2=Matteo |last3=Rea |first3=Brice R. |last4=Bingham |first4=Robert G. |last5=Oien |first5=Rachel P. |last6=Adamson |first6=Kathryn |last7=Ely |first7=Jeremy C. |last8=Mullan |first8=Donal J. |last9=Pellitero |first9=Ramón |last10=Tomkins |first10=Matt D. |title=60 million years of glaciation in the Transantarctic Mountains |journal=Nature Communications |date=21 September 2022 |volume=13 |issue=1 |pages=5526 |doi=10.1038/s41467-022-33310-z |language=en |issn=2041-1723|hdl=2164/19437 |hdl-access=free }}</ref> a proper ice sheet did not begin to form until the [[Eocene–Oligocene extinction event]] about 34 million years ago, when the atmospheric {{CO2}} levels fell to below 750 [[parts per million]]. It was initially unstable, and did not grow to consistently cover the entire continent until 32.8 million years ago, when the {{CO2}} levels had further declined to below 600 ppm.<ref name="Galeotti2016">{{cite journal |last1=Galeotti |first1=Simone |last2=DeConto |first2=Robert |last3=Naish |first3=Timothy |last4=Stocchi |first4=Paolo |last5=Florindo |first5=Fabio |last6=Pagani |first6=Mark |last7=Barrett |first7=Peter |last8=Bohaty |first8=Steven M. |last9=Lanci |first9=Luca |last10=Pollard |first10=David |last11=Sandroni |first11=Sonia |last12=Talarico |first12=Franco M. |last13=Zachos |first13=James C. |title=Antarctic Ice Sheet variability across the Eocene-Oligocene boundary climate transition |journal=Science |date=10 March 2016 |volume=352 |issue=6281 |pages=76–80 |doi=10.1126/science.aab066 }}</ref> |
||
Afterwards, the East Antarctic Ice Sheet declined substantially during the [[Middle Miocene Climatic Optimum]] 15 million years ago, yet started to recover about 13.96 million years ago.<ref name="Barr2022" /> Since then, it had been largely stable, experiencing "minimal" change in its surface extent over the past 8 million years.<ref>{{Cite journal|last=Shakun |first=Jeremy D. |display-authors=etal |year=2018 |title=Minimal East Antarctic Ice Sheet retreat onto land during the past eight million years |journal=Nature |volume=558 |issue=7709 |pages=284–287 |doi=10.1038/s41586-018-0155-6 |pmid=29899483 |bibcode=2018Natur.558..284S |osti=1905199 |s2cid=49185845 |url=https://www.osti.gov/biblio/1905199 }}</ref> While it had still thinned by at least {{Convert|500|m|ft|abbr=on}} during the [[Pleistocene]] period, and by less than {{Convert|50|m|ft|abbr=on}} since [[Last Glacial Maximum]], the land area covered by ice in East Antarctica remained largely the same.<ref>{{cite journal|doi=10.1016/j.quascirev.2014.05.007|journal=Quaternary Science Reviews|author=Yusuke Suganuma|author2=Hideki Miura|author3=Albert Zondervan|author4=Jun'ichi Okuno|date=August 2014|volume=97|title=East Antarctic deglaciation and the link to global cooling during the Quaternary: evidence from glacial geomorphology and 10Be surface exposure dating of the Sør Rondane Mountains, Dronning Maud Land|pages=102–120|bibcode = 2014QSRv...97..102S |doi-access=free}}</ref> Contrastingly, the smaller West Antarctic ice sheet is thought to have largely collapsed as recently as during the [[Eemian]] period, about 125,000 years ago.<ref>{{Cite web|url=https://www.science.org/content/article/discovery-recent-antarctic-ice-sheet-collapse-raises-fears-new-global-flood|title=Discovery of recent Antarctic ice sheet collapse raises fears of a new global flood|last=Voosen|first=Paul|date=2018-12-18|website=Science|language=en|access-date=2018-12-28}}</ref><ref>{{Cite journal|last1=Turney|first1=Chris S. M.|last2=Fogwill|first2=Christopher J.|last3=Golledge|first3=Nicholas R.|last4=McKay |first4=Nicholas P. |last5=Sebille |first5=Erik van |last6=Jones |first6=Richard T. |last7=Etheridge |first7=David|last8=Rubino |first8=Mauro|last9=Thornton|first9=David P. |last10=Davies|first10=Siwan M.|last11=Ramsey|first11=Christopher Bronk|date=2020-02-11|title=Early Last Interglacial ocean warming drove substantial ice mass loss from Antarctica|journal=Proceedings of the National Academy of Sciences |volume=117 |issue=8 |pages=3996–4006 |language=en |doi=10.1073/pnas.1902469117|issn=0027-8424 |pmid=32047039 |pmc=7049167 |bibcode=2020PNAS..117.3996T|doi-access=free}}</ref><ref name="Carlson2018">{{Cite conference |last1=Carlson |first1=Anders E |last2=Walczak |first2=Maureen H |last3=Beard |first3=Brian L |last4=Laffin |first4=Matthew K |last5=Stoner |first5=Joseph S |last6=Hatfield |first6=Robert G |date=10 December 2018 |title=Absence of the West Antarctic ice sheet during the last interglaciation |url=https://agu.confex.com/agu/fm18/meetingapp.cgi/Paper/421418 |conference=American Geophysical Union Fall Meeting }}</ref><ref name="Lau2023">{{Cite journal |last1=Lau |first1=Sally C. Y. |last2=Wilson |first2=Nerida G. |last3=Golledge |first3=Nicholas R. |last4=Naish |first4=Tim R. |last5=Watts |first5=Phillip C. |last6=Silva |first6=Catarina N. S. |last7=Cooke |first7=Ira R. |last8=Allcock |first8=A. Louise |last9=Mark |first9=Felix C. |last10=Linse |first10=Katrin |date=21 December 2023 |title=Genomic evidence for West Antarctic Ice Sheet collapse during the Last Interglacial |journal=Science |language=en |volume=382 |issue=6677 |pages=1384–1389 |doi=10.1126/science.ade0664 }}</ref><ref>{{Cite web |last=AHMED |first=Issam |title=Antarctic octopus DNA reveals ice sheet collapse closer than thought |url=https://phys.org/news/2023-12-antarctic-octopus-dna-reveals-ice.html |access-date=2023-12-23 |website=phys.org |language=en}}</ref> |
Afterwards, the East Antarctic Ice Sheet declined substantially during the [[Middle Miocene Climatic Optimum]] 15 million years ago, yet started to recover about 13.96 million years ago.<ref name="Barr2022" /> Since then, it had been largely stable, experiencing "minimal" change in its surface extent over the past 8 million years.<ref>{{Cite journal|last=Shakun |first=Jeremy D. |display-authors=etal |year=2018 |title=Minimal East Antarctic Ice Sheet retreat onto land during the past eight million years |journal=Nature |volume=558 |issue=7709 |pages=284–287 |doi=10.1038/s41586-018-0155-6 |pmid=29899483 |bibcode=2018Natur.558..284S |osti=1905199 |s2cid=49185845 |url=https://www.osti.gov/biblio/1905199 }}</ref> While it had still thinned by at least {{Convert|500|m|ft|abbr=on}} during the [[Pleistocene]] period, and by less than {{Convert|50|m|ft|abbr=on}} since [[Last Glacial Maximum]], the land area covered by ice in East Antarctica remained largely the same.<ref>{{cite journal|doi=10.1016/j.quascirev.2014.05.007|journal=Quaternary Science Reviews|author=Yusuke Suganuma|author2=Hideki Miura|author3=Albert Zondervan|author4=Jun'ichi Okuno|date=August 2014|volume=97|title=East Antarctic deglaciation and the link to global cooling during the Quaternary: evidence from glacial geomorphology and 10Be surface exposure dating of the Sør Rondane Mountains, Dronning Maud Land|pages=102–120|bibcode = 2014QSRv...97..102S |doi-access=free}}</ref> Contrastingly, the smaller West Antarctic ice sheet is thought to have largely collapsed as recently as during the [[Eemian]] period, about 125,000 years ago.<ref>{{Cite web|url=https://www.science.org/content/article/discovery-recent-antarctic-ice-sheet-collapse-raises-fears-new-global-flood|title=Discovery of recent Antarctic ice sheet collapse raises fears of a new global flood|last=Voosen|first=Paul|date=2018-12-18|website=Science|language=en|access-date=2018-12-28}}</ref><ref>{{Cite journal|last1=Turney|first1=Chris S. M.|last2=Fogwill|first2=Christopher J.|last3=Golledge|first3=Nicholas R.|last4=McKay |first4=Nicholas P. |last5=Sebille |first5=Erik van |last6=Jones |first6=Richard T. |last7=Etheridge |first7=David|last8=Rubino |first8=Mauro|last9=Thornton|first9=David P. |last10=Davies|first10=Siwan M.|last11=Ramsey|first11=Christopher Bronk|date=2020-02-11|title=Early Last Interglacial ocean warming drove substantial ice mass loss from Antarctica|journal=Proceedings of the National Academy of Sciences |volume=117 |issue=8 |pages=3996–4006 |language=en |doi=10.1073/pnas.1902469117|issn=0027-8424 |pmid=32047039 |pmc=7049167 |bibcode=2020PNAS..117.3996T|doi-access=free}}</ref><ref name="Carlson2018">{{Cite conference |last1=Carlson |first1=Anders E |last2=Walczak |first2=Maureen H |last3=Beard |first3=Brian L |last4=Laffin |first4=Matthew K |last5=Stoner |first5=Joseph S |last6=Hatfield |first6=Robert G |date=10 December 2018 |title=Absence of the West Antarctic ice sheet during the last interglaciation |url=https://agu.confex.com/agu/fm18/meetingapp.cgi/Paper/421418 |conference=American Geophysical Union Fall Meeting }}</ref><ref name="Lau2023">{{Cite journal |last1=Lau |first1=Sally C. Y. |last2=Wilson |first2=Nerida G. |last3=Golledge |first3=Nicholas R. |last4=Naish |first4=Tim R. |last5=Watts |first5=Phillip C. |last6=Silva |first6=Catarina N. S. |last7=Cooke |first7=Ira R. |last8=Allcock |first8=A. Louise |last9=Mark |first9=Felix C. |last10=Linse |first10=Katrin |date=21 December 2023 |title=Genomic evidence for West Antarctic Ice Sheet collapse during the Last Interglacial |journal=Science |language=en |volume=382 |issue=6677 |pages=1384–1389 |doi=10.1126/science.ade0664 }}</ref><ref>{{Cite web |last=AHMED |first=Issam |title=Antarctic octopus DNA reveals ice sheet collapse closer than thought |url=https://phys.org/news/2023-12-antarctic-octopus-dna-reveals-ice.html |access-date=2023-12-23 |website=phys.org |language=en}}</ref> |
||
== Territorial claims == |
|||
{{main|Territorial claims in Antarctica}} |
|||
| ⚫ | Many countries |
||
== Recent climate change == |
== Recent climate change == |
||
[[File:Xin 2023 AIS SAT trends.jpg|thumb|East Antarctica had demonstrated cooling in the 1980s and 1990s, even as the West Antarctica warmed. This trend had largely reversed in 2000s and 2010s.<ref name="Xin2023" />]] |
|||
Cooling in East Antarctica during the decades of the 1980s and 1990s partially offset the impact of [[climate change]] on the West Antarctic Ice Sheet, which has warmed by more than 0.1 °C/decade in the last 50 years. The continent-wide average surface temperature trend of Antarctica is positive and [[Statistical significance|statistically significant]] at >0.05 °C/decade since 1957.<ref name="SteigSchneider2009" /> |
|||
Because East Antarctica is already cooler than West Antarctica, and is also located at substantially greater elevation,<ref name="Singh2020" /> it had been less sensitive to [[climate change]], and had actually experienced cooling in the the 1980s and 1990s, even as the West Antarctic Ice Sheet has warmed by more than 0.1 °C/decade since the 1950s.<ref name="SteigSchneider2009" /> After 2000, the trend had reversed due to local changes in atmospheric circulation: the warming of West Antarctica locations slowed or partially reversed between 2000 and 2020, while the East Antarctica interior had demonstated clear warming. This change in circulation had occurred partly due to natural variability, and partly as the result of the [[ozone layer]] beginning to recover following the [[Montreal Protocol]].<ref name="Xin2023">{{cite journal |last1=Xin |first1=Meijiao |last2=Clem |first2=Kyle R |last3=Turner |first3=John |last4=Stammerjohn |first4=Sharon E |last5=Zhu |first5=Jiang |last6=Cai |first6=Wenju |last7=Li |first7=Xichen |date=2 June 2023 |title=West-warming East-cooling trend over Antarctica reversed since early 21st century driven by large-scale circulation variation |journal=Environmental Research Letters |volume=18 |issue=6 |page=064034 |doi=10.1088/1748-9326/acd8d4 }}</ref><ref>{{cite journal |last1=Xin |first1=Meijiao |last2=Li |first2=Xichen |last3=Stammerjohn |first3=Sharon E |last4=Cai |first4=Wenju |last5=Zhu |first5=Jiang |last6=Turner |first6=John |last7=Clem |first7=Kyle R |last8=Song |first8=Chentao |last9=Wang |first9=Wenzhu |last10=Hou |first10=Yurong |date=17 May 2023 |title=A broadscale shift in antarctic temperature trends |journal=Climate Dynamics |volume=61 |pages=4623–4641 |doi=10.1007/s00382-023-06825-4 }}</ref> The continent-wide average surface temperature trend of Antarctica is positive and [[Statistical significance|statistically significant]] at >0.05 °C/decade since 1957.<ref name="SteigSchneider2009">{{cite journal |last1=Steig |first1=E. J. |last2=Schneider |first2=D. P. |last3=Rutherford |first3=S. D. |last4=Mann |first4=M. E. |last5=Comiso |first5=J. C. |last6=Shindell |first6=D. T. |year=2009 |title=Warming of the Antarctic ice-sheet surface since the 1957 International Geophysical Year |journal=[[Nature (journal)|Nature]] |url=https://docs.rwu.edu/fcas_fp/313 |volume=457 |issue=7228 |pages=459–462 |doi=10.1038/nature07669 |pmid=19158794 |bibcode=2009Natur.457..459S |s2cid=4410477 }}</ref> |
|||
[[File:Denman_oli_2020-057-059_lrg-labeled.svg|thumb|Aerial view of ice flows at Denman Glacier, one of the relatively few glaciers in the East Antarctica known to be losing mass.<ref name="Brancato2020" />]] |
|||
The limited warming and already low temperatures over East Antarctica mean that as of early 2020s, the majority of observational evidence shows it continuing to gain mass.<ref name="King2012" /><ref name="IMBIE2018">{{cite journal |title=Mass balance of the Antarctic Ice Sheet from 1992 to 2017 |journal=Nature |date=13 June 2018 |volume=558 |issue=7709 |pages=219–222 |doi=10.1038/s41586-018-0179-y |hdl=2268/225208 |pmid=29899482 |bibcode=2018Natur.558..219I |author1=IMBIE team |s2cid=49188002 |hdl-access=free }}</ref><ref name="Zwally2021" /><ref name="NASA2023">{{cite web |title=Antarctic Ice Mass Loss 2002-2023 |url=https://svs.gsfc.nasa.gov/31158 |author=NASA |date=7 July 2023 }}</ref> for instance, [[GRACE and GRACE-FO|GRACE satellite]] data indicated East Antarctica mass gain of {{nowrap|60 ± 13}} billion tons per year between 2002 to 2010.<ref name="King2012">{{Cite journal | last1 = King | first1 = M. A. | last2 = Bingham | first2 = R. J. | last3 = Moore | first3 = P. | last4 = Whitehouse | first4 = P. L. | last5 = Bentley | first5 = M. J. | last6 = Milne | first6 = G. A. | doi = 10.1038/nature11621 | title = Lower satellite-gravimetry estimates of Antarctic sea-level contribution | journal = Nature | volume = 491 | issue = 7425 | pages = 586–589 | year = 2012 | pmid = 23086145|bibcode = 2012Natur.491..586K | s2cid = 4414976 }}</ref> Some analyses have suggested it already begun to lose mass in 2000s,<ref>{{cite journal |last1=Chen |first1=J. L. |last2=Wilson |first2=C. R. |last3=Blankenship |first3=D. |last4=Tapley |first4=B. D. |year=2009 |title=Accelerated Antarctic ice loss from satellite gravity measurements |journal=Nature Geoscience |volume=2 |issue=12 |pages=859 |doi=10.1038/ngeo694 |bibcode=2009NatGe...2..859C |s2cid=130927366 }}</ref><ref>{{cite journal |last1=Rignot |first1=Eric |last2=Mouginot |first2=Jérémie |last3=Scheuchl |first3=Bernd |last4=van den Broeke |first4=Michiel |last5=van Wessem |first5=Melchior J. |last6=Morlighem |first6=Mathieu |title=Four decades of Antarctic Ice Sheet mass balance from 1979–2017 |journal=Proceedings of the National Academy of Sciences |date=22 January 2019 |volume=116 |issue=4 |pages=1095–1103 |doi=10.1073/pnas.1812883116 |pmid=30642972 |pmc=6347714 |bibcode=2019PNAS..116.1095R |doi-access=free }}</ref>, but they over-extrapolated some observed losses onto the poorly-observed areas, and a more complete observational record shows continued mass gain.<ref name="Zwally2021">{{Cite journal |last1=Zwally |first1=H. Jay |last2=Robbins |first2=John W. |last3=Luthcke |first3=Scott B. |last4=Loomis |first4=Bryant D. |last5=Rémy |first5=Frédérique |date=29 March 2021 |title=Mass balance of the Antarctic ice sheet 1992–2016: reconciling results from GRACE gravimetry with ICESat, ERS1/2 and Envisat altimetry |journal=Journal of Glaciology |language=en |volume=67 |issue=263 |pages=533-559 |doi=10.1017/jog.2021.8 |quote=Although their methods of interpolation or extrapolation for areas with unobserved output velocities have an insufficient description for the evaluation of associated errors, such errors in previous results (Rignot and others, 2008) caused large overestimates of the mass losses as detailed in Zwally and Giovinetto (Zwally and Giovinetto, 2011).}}</ref> |
|||
| ⚫ | [[File:1900-2300 Long-term projections of sea level rise.svg|thumb|If countries cut [[greenhouse gas]] emissions significantly (lowest trace), then [[sea level rise]] by 2100 can be limited to {{cvt|0.3–0.6|m|ft|frac=2}}.<ref name="NASA_SLR_2021"/> If the emissions instead accelerate rapidly (top trace), sea levels could rise {{cvt|5|m|ft|frac=2}} by the year 2300. Higher levels of sea level rise would involve ice loss from the East Antarctica.<ref name=NASA_SLR_2021>{{cite web |title=Anticipating Future Sea Levels |url=https://earthobservatory.nasa.gov/images/148494/anticipating-future-sea-levels |website=EarthObservatory.NASA.gov |publisher=National Aeronautics and Space Administration (NASA) |archive-url=https://web.archive.org/web/20210707220354/https://earthobservatory.nasa.gov/images/148494/anticipating-future-sea-levels |archive-date=7 July 2021 |date=2021 |url-status=live }}</ref>]] |
||
An early analysis of [[Gravity Recovery and Climate Experiment|GRACE]]-based studies data indicated that the EAIS was losing mass at a rate of 57 billion tonnes per year<ref name="ChenWilson2009" /> and that the ''total'' Antarctic ice sheet (including [[West Antarctic Ice Sheet|WAIS]], and EAIS coastal areas) was losing mass at a rate of 152 cubic kilometers (c. 139 billion tonnes) per year.<ref name="VelicognaWahrScott2006" /> A more recent estimate published in November 2012 and based on the GRACE data as well as on an improved glacial isostatic adjustment model indicates that East Antarctica actually gained mass from 2002 to 2010 at a rate of {{nowrap|60 ± 13 Gt/y}}.<ref name=King2012>{{Cite journal | last1 = King | first1 = M. A. | last2 = Bingham | first2 = R. J. | last3 = Moore | first3 = P. | last4 = Whitehouse | first4 = P. L. | last5 = Bentley | first5 = M. J. | last6 = Milne | first6 = G. A. | doi = 10.1038/nature11621 | title = Lower satellite-gravimetry estimates of Antarctic sea-level contribution | journal = Nature | volume = 491 | issue = 7425 | pages = 586–589 | year = 2012 | pmid = 23086145|bibcode = 2012Natur.491..586K | s2cid = 4414976 }}</ref> |
|||
| ⚫ | Because it is currently gaining mass, East Antarctic Ice Sheet is not expected to play a role in the 21st century [[sea level rise]]. However, it is still subject to adverse change, such as the retreat of [[Denman Glacier]],<ref name="Brancato2020">{{cite journal|last1=Brancato|first1=V.|last2=Rignot|first2=E.|last3=Milillo|first3=P.|last4=Morlighem|first4=M.|last5=Mouginot|first5=J.|last6=An|first6=L.|last7=Scheuchl|first7=B.|last8=Jeong|first8=S.|last9=Rizzoli|first9=P.|last10=Bueso Bello|first10=J.L.|last11=Prats-Iraola|first11=P.|title=Grounding line retreat of Denman Glacier, East Antarctica, measured with COSMO-SkyMed radar interferometry data|journal=Geophysical Research Letters|year=2020| volume=47 | issue=7 |pages=e2019GL086291|issn=0094-8276|doi=10.1029/2019GL086291| bibcode=2020GeoRL..4786291B |doi-access=free}}</ref><ref>{{cite news|newspaper=[[BBC]]|url=https://www.bbc.com/news/science-environment-52007637|title=Climate change: Earth's deepest ice canyon vulnerable to melting |last=Amos|first=Jonathan|date=2020-03-23}}</ref> or the flow of warmer ocean current into ice cavities beneath the stabilizing [[ice shelf|ice shelves]] like the [[Fimbul Ice Shelf|Fimbulisen]] ice shelf in the [[Queen Maud Land]].<ref>{{Cite journal |last=Lauber |first=Julius |last2=Hattermann |first2=Torr |last3=de Steur |first3=Laura |last4=Darelius |first4=Elin |last5=Auger |first5=Matthis |last6=Anders Nost |first6=Ole |last7=Moholdt |first7=Geir |date=21 September 2023 |title=Warming beneath an East Antarctic ice shelf due to increased subpolar westerlies and reduced sea ice |url=https://www.nature.com/articles/s41561-023-01273-5 |journal=Nature Geoscience |volume=16 |pages=877-885}}</ref> If global warming were to reach higher levels, then the EAIS would play an increasingly larger role in sea level rise occurring after 2100. According to the most recent reports of the [[Intergovernmental Panel on Climate Change]] ([[SROCC]] and the [[IPCC Sixth Assessment Report]]), the most intense [[climate change scenario]], where the anthropogenic emissions increase continuously, [[Representative Concentration Pathway|RCP8.5]], would result in Antarctica alone losing a [[median]] of {{convert|1.46|m|ftin|abbr=on}} ([[confidence interval]] between {{convert|60|cm|ft|abbr=on}} and {{convert|2.89|m|ftin|abbr=on}}), which would involve some loss from the EAIS in addition to the erosion of the WAIS. This Antarctica-only sea level rise would be in addition to ice losses from the [[Greenland ice sheet]] and [[retreat of glaciers since 1850|mountain glaciers]], as well as the [[thermal expansion]] of ocean water.<ref name="IPCC AR6 WG1 Ch.9">{{Cite journal |last1=Fox-Kemper |first1=B. |last2=Hewitt |first2=H.T.|author2-link=Helene Hewitt |last3=Xiao |first3=C. |last4=Aðalgeirsdóttir |first4=G. |last5=Drijfhout |first5=S.S. |last6=Edwards |first6=T.L. |last7=Golledge |first7=N.R. |last8=Hemer |first8=M. |last9=Kopp |first9=R.E. |last10=Krinner |first10=G. |last11=Mix |first11=A. |date=2021 |editor-last=Masson-Delmotte |editor-first=V. |editor2-last=Zhai |editor2-first=P. |editor3-last=Pirani |editor3-first=A. |editor4-last=Connors |editor4-first=S.L. |editor5-last=Péan |editor5-first=C. |editor6-last=Berger |editor6-first=S. |editor7-last=Caud |editor7-first=N. |editor8-last=Chen |editor8-first=Y. |editor9-last=Goldfarb |editor9-first=L. |title=Chapter 9: Ocean, Cryosphere and Sea Level Change |journal=Climate Change 2021: The Physical Science Basis. Contribution of Working Group I to the Sixth Assessment Report of the Intergovernmental Panel on Climate Change |url=https://www.ipcc.ch/report/ar6/wg1/downloads/report/IPCC_AR6_WGI_Chapter09.pdf |publisher=Cambridge University Press, Cambridge, UK and New York, NY, USA |pages=1270–1272 }}</ref> |
||
| ⚫ | [[File:1900-2300 Long-term projections of sea level rise.svg|thumb|If countries cut [[greenhouse gas]] emissions significantly (lowest trace), then [[sea level rise]] by 2100 can be limited to {{cvt|0.3–0.6|m|ft|frac=2}}.<ref name="NASA_SLR_2021"/> If the emissions instead accelerate rapidly (top trace), sea levels could rise {{cvt|5|m|ft|frac=2}} by the year 2300.<ref name=NASA_SLR_2021>{{cite web |title=Anticipating Future Sea Levels |url=https://earthobservatory.nasa.gov/images/148494/anticipating-future-sea-levels |website=EarthObservatory.NASA.gov |publisher=National Aeronautics and Space Administration (NASA) |archive-url=https://web.archive.org/web/20210707220354/https://earthobservatory.nasa.gov/images/148494/anticipating-future-sea-levels |archive-date=7 July 2021 |date=2021 |url-status=live }}</ref>]] |
||
| ⚫ | Because it is currently gaining mass, East Antarctic Ice Sheet is not expected to play a role in the 21st century [[sea level rise]]. However, it is still subject to adverse change, such as the flow of warmer ocean current into ice cavities beneath the stabilizing [[ice shelf|ice shelves]] like the [[Fimbul Ice Shelf|Fimbulisen]] ice shelf in the [[Queen Maud Land]].<ref>{{Cite journal |last=Lauber |first=Julius |last2=Hattermann |first2=Torr |last3=de Steur |first3=Laura |last4=Darelius |first4=Elin |last5=Auger |first5=Matthis |last6=Anders Nost |first6=Ole |last7=Moholdt |first7=Geir |date=21 September 2023 |title=Warming beneath an East Antarctic ice shelf due to increased subpolar westerlies and reduced sea ice |url=https://www.nature.com/articles/s41561-023-01273-5 |journal=Nature Geoscience |volume=16 |pages=877-885}}</ref> If global warming were to reach higher levels, then the EAIS would play an increasingly larger role in sea level rise occurring after 2100. According to the most recent reports of the [[Intergovernmental Panel on Climate Change]] ([[SROCC]] and the [[IPCC Sixth Assessment Report]]), the most intense [[climate change scenario]], where the anthropogenic emissions increase continuously, [[Representative Concentration Pathway|RCP8.5]], would result in Antarctica alone losing a [[median]] of {{convert|1.46|m|ftin|abbr=on}} ([[confidence interval]] between {{convert|60|cm|ft|abbr=on}} and {{convert|2.89|m|ftin|abbr=on}}), which would involve some loss from the EAIS in addition to the erosion of the WAIS. This Antarctica-only sea level rise would be in addition to ice losses from the [[Greenland ice sheet]] and [[retreat of glaciers since 1850|mountain glaciers]], as well as the [[thermal expansion]] of ocean water.<ref name="IPCC AR6 WG1 Ch.9">{{Cite journal |last1=Fox-Kemper |first1=B. |last2=Hewitt |first2=H.T.|author2-link=Helene Hewitt |last3=Xiao |first3=C. |last4=Aðalgeirsdóttir |first4=G. |last5=Drijfhout |first5=S.S. |last6=Edwards |first6=T.L. |last7=Golledge |first7=N.R. |last8=Hemer |first8=M. |last9=Kopp |first9=R.E. |last10=Krinner |first10=G. |last11=Mix |first11=A. |date=2021 |editor-last=Masson-Delmotte |editor-first=V. |editor2-last=Zhai |editor2-first=P. |editor3-last=Pirani |editor3-first=A. |editor4-last=Connors |editor4-first=S.L. |editor5-last=Péan |editor5-first=C. |editor6-last=Berger |editor6-first=S. |editor7-last=Caud |editor7-first=N. |editor8-last=Chen |editor8-first=Y. |editor9-last=Goldfarb |editor9-first=L. |title=Chapter 9: Ocean, Cryosphere and Sea Level Change |journal=Climate Change 2021: The Physical Science Basis. Contribution of Working Group I to the Sixth Assessment Report of the Intergovernmental Panel on Climate Change |url=https://www.ipcc.ch/report/ar6/wg1/downloads/report/IPCC_AR6_WGI_Chapter09.pdf |publisher=Cambridge University Press, Cambridge, UK and New York, NY, USA |pages=1270–1272 }}</ref> |
||
== Long-term future == |
== Long-term future == |
||
[[File:Crotti_2022_Wilkes_Basin.png|thumb|Retreat of [[Cook Glacier]] - a key part of the Wilkes Basin - during the [[Eemian]] ~120,000 years ago and an earlier [[Pleistocene]] interglacial ~330,000 years ago. These retreats would have added about {{convert|0.5|m|ftin|abbr=on}} and {{convert|0.9|m|ftin|abbr=on}} to sea level rise.<ref name="Crotti2022" />]] |
|||
If the warming were to remain at elevated levels for a long time, the East Antarctic Ice Sheet would eventually become the dominant contributor to sea level rise, simply because it contains far more ice than any other large ice mass. First, though, it would see sustained erosion at the so-called subglacial basins, such as [[Totten Glacier]] and [[Wilkes Basin]], which are located in vulnerable locations below the sea level. Estimates suggest that they would be committed to disappearance once the global warming reaches {{convert|3|C-change|F-change}}, although the plausible temperature range is between {{convert|2|C-change|F-change}} and {{convert|6|C-change|F-change}}. Once it becomes too warm for these subglacial basins, their collapse would unfold over a period of around 2,000 years, |
If the warming were to remain at elevated levels for a long time, the East Antarctic Ice Sheet would eventually become the dominant contributor to sea level rise, simply because it contains far more ice than any other large ice mass. First, though, it would see sustained erosion at the so-called subglacial basins, such as [[Totten Glacier]] and [[Wilkes Basin]], which are located in vulnerable locations below the sea level. Estimates suggest that they would be committed to disappearance once the global warming reaches {{convert|3|C-change|F-change}}, although the plausible temperature range is between {{convert|2|C-change|F-change}} and {{convert|6|C-change|F-change}}. Once it becomes too warm for these subglacial basins, their collapse would unfold over a period of around 2,000 years, although it may be as fast as 500 years or as slow as 10,000 years.<ref name="ArmstrongMcKay2022" /><ref name="ArmstrongMcKayExplainer" /> The loss of all this ice would ultimately add between {{convert|1.4|m|ftin|abbr=on}} and {{convert|6.4|m|ftin|abbr=on}} to sea levels, depending on the [[ice sheet model]] used. [[Isostatic rebound]] of the newly ice-free land would also add {{convert|8|cm|ftin|abbr=on}} and {{convert|57|cm|ftin|abbr=on}}, respectively.<ref name="Pan2021">{{Cite journal|last1=Pan |first1=Linda |last2=Powell |first2=Evelyn M. |last3=Latychev |first3=Konstantin |last4=Mitrovica |first4=Jerry X. |last5=Creveling |first5=Jessica R. |last6=Gomez |first6=Natalya |last7=Hoggard |first7=Mark J. |last8=Clark |first8=Peter U. |date=30 April 2021 |title=Rapid postglacial rebound amplifies global sea level rise following West Antarctic Ice Sheet collapse |journal=Science Advances |volume=7 |issue=18 |doi=10.1126/sciadv.abf7787 }}</ref> Evidence from the [[Pleistocene]] shows that partial loss can also occur at lower warming levels: Wilkes Basin is estimated to have lost enough ice to add {{convert|0.5|m|ftin|abbr=on}} to sea levels between 115,000 and 129,000 years ago, during the [[Eemian]], and about {{convert|0.9|m|ftin|abbr=on}} between 318,000 and 339,000 years ago, during the [[Marine Isotope Stage 9]].<ref name="Crotti2022">{{cite journal |last1=Crotti |first1=Ilaria |last2=Quiquet |first2=Aurélien |last3=Landais |first3=Amaelle |last4=Stenni |first4=Barbara |last5=Wilson |first5=David J. |last6=Severi |first6=Mirko |last7=Mulvaney |first7=Robert |last8=Wilhelms |first8=Frank |last9=Barbante |first9=Carlo |last10=Frezzotti |first10=Massimo |date=10 September 2022 |title=Wilkes subglacial basin ice sheet response to Southern Ocean warming during late Pleistocene interglacials |journal=Nature Communications |volume=13 |pages=5328 |doi=10.1038/s41467-022-32847-3 }}</ref> |
||
The entire East Antarctic Ice Sheet holds enough ice to raise global sea levels by {{Convert|53.3|m|ft|abbr=on}}.<ref name="Fretwell2013" /> Its complete melting is also possible, but it would require very high warming and a lot of time: in 2022, an extensive assessment of [[tipping points in the climate system]] published in the [[Science Magazine]] concluded that the ice sheet would most likely be committed to complete disappearance only once the global warming reaches about {{convert|7.5|C-change|F-change}}, with the minimum and the maximum range between {{convert|5|C-change|F-change}} and {{convert|10|C-change|F-change}}. It would also take a minimum of 10,000 years for the entire ice sheet to be lost. If it were to disappear, then the change in [[ice-albedo feedback]] would increase the global temperature by {{convert|0.6|C-change|F-change}}, while the regional temperatures would increase by around {{convert|2|C-change|F-change}}. The loss of the subglacial basins alone would only add about {{convert|0.05|C-change|F-change}} to global temperatures due to their relatively limited area.<ref name="ArmstrongMcKay2022" /><ref name="ArmstrongMcKayExplainer" /> |
The entire East Antarctic Ice Sheet holds enough ice to raise global sea levels by {{Convert|53.3|m|ft|abbr=on}}.<ref name="Fretwell2013" /> Its complete melting is also possible, but it would require very high warming and a lot of time: in 2022, an extensive assessment of [[tipping points in the climate system]] published in the [[Science Magazine]] concluded that the ice sheet would most likely be committed to complete disappearance only once the global warming reaches about {{convert|7.5|C-change|F-change}}, with the minimum and the maximum range between {{convert|5|C-change|F-change}} and {{convert|10|C-change|F-change}}. It would also take a minimum of 10,000 years for the entire ice sheet to be lost. If it were to disappear, then the change in [[ice-albedo feedback]] would increase the global temperature by {{convert|0.6|C-change|F-change}}, while the regional temperatures would increase by around {{convert|2|C-change|F-change}}. The loss of the subglacial basins alone would only add about {{convert|0.05|C-change|F-change}} to global temperatures due to their relatively limited area.<ref name="ArmstrongMcKay2022">{{Cite journal |last1=Armstrong McKay |first1=David|last2=Abrams |first2=Jesse |last3=Winkelmann |first3=Ricarda |last4=Sakschewski |first4=Boris |last5=Loriani |first5=Sina |last6=Fetzer |first6=Ingo|last7=Cornell|first7=Sarah |last8=Rockström |first8=Johan |last9=Staal |first9=Arie |last10=Lenton |first10=Timothy |date=9 September 2022 |title=Exceeding 1.5°C global warming could trigger multiple climate tipping points |url=https://www.science.org/doi/10.1126/science.abn7950 |journal=Science |language=en |volume=377 |issue=6611 |doi=10.1126/science.abn7950 |hdl=10871/131584 |s2cid=252161375 |issn=0036-8075|hdl-access=free }}</ref><ref name="ArmstrongMcKayExplainer">{{Cite web |last=Armstrong McKay |first=David |date=9 September 2022 |title=Exceeding 1.5°C global warming could trigger multiple climate tipping points – paper explainer |url=https://climatetippingpoints.info/2022/09/09/climate-tipping-points-reassessment-explainer/ |access-date=2 October 2022 |website=climatetippingpoints.info |language=en}}</ref> |
||
== See also == |
== See also == |
||
| Line 43: | Line 52: | ||
== References == |
== References == |
||
{{Reflist}} |
|||
{{reflist|2| refs = |
|||
<ref name="ChenWilson2009"> |
|||
{{cite journal| doi = 10.1038/ngeo694| last1 = Chen| first1 = J. L.| last2 = Wilson| first2 = C. R.| last3 = Blankenship| first3 = D.| last4 = Tapley| first4 = B. D.| year = 2009| title = Accelerated Antarctic ice loss from satellite gravity measurements| journal = Nature Geoscience| volume = 2| issue = 12| pages = 859| bibcode = 2009NatGe...2..859C| s2cid = 130927366}} |
|||
</ref> |
|||
<ref name="VelicognaWahrScott2006"> |
|||
{{cite web |
|||
| last1 = Velicogna |
|||
| first1 = Isabella |author-link1=Isabella Velicogna |
|||
| last2 = Wahr |
|||
| first2 = John |author-link2 = John M. Wahr |
|||
| last3 = Scott |
|||
| first3 = Jim |
|||
| date = 2006-03-02 |
|||
| title = Antarctic ice sheet losing mass, says University of Colorado study |
|||
| work = [[American Association for the Advancement of Science]] |
|||
| publisher = University of Colorado at Boulder |
|||
| url = http://www.eurekalert.org/pub_releases/2006-03/uoca-ais022806.php |
|||
| access-date = 22 October 2011 |
|||
}} |
|||
</ref> |
|||
<ref name="SteigSchneider2009"> |
|||
{{cite journal| doi = 10.1038/nature07669| last1 = Steig | first1 = E. J.| last2 = Schneider | first2 = D. P.| last3 = Rutherford | first3 = S. D.| last4 = Mann | first4 = M. E.| last5 = Comiso | first5 = J. C.| last6 = Shindell | first6 = D. T.| year = 2009| title = Warming of the Antarctic ice-sheet surface since the 1957 International Geophysical Year| journal = [[Nature (journal)|Nature]]| volume = 457| issue = 7228| pages = 459–462| pmid = 19158794|bibcode = 2009Natur.457..459S | s2cid = 4410477 | url = https://docs.rwu.edu/fcas_fp/313 }} |
|||
</ref> |
|||
}} |
|||
{{Antarctica topics}} |
{{Antarctica topics}} |
||
| ⚫ | |||
[[Category:Ice sheets of Antarctica]] |
[[Category:Ice sheets of Antarctica]] |
||
[[Category:East Antarctica]] |
[[Category:East Antarctica]] |
||
Revision as of 17:35, 15 January 2024
| East Antarctic ice sheet | |
|---|---|
 | |
| Type | Ice sheet |
| Thickness | ~2.2 km (1.4 mi) (average)[1], ~4.9 km (3.0 mi) (maximum) [2] |
The East Antarctic Ice Sheet (EAIS) lies between 45° west and 168° east longitudinally. It was first formed around 34 million years ago,[3] and it is the largest ice sheet on the entire planet, with far greater volume than the Greenland ice sheet or the West Antarctic Ice Sheet (WAIS), from which it is separated by the Transantarctic Mountains. The ice sheet is around 2.2 km (1.4 mi) thick on average and is 4,897 m (16,066 ft) at its thickest point.[2] It is also home to the geographic South Pole and the Amundsen–Scott South Pole Station.
The surface of the EAIS is the driest, windiest, and coldest place on Earth. Lack of moisture in the air, high albedo from the snow as well as the surface's consistently high elevation[4] results in the reported cold temperature records of nearly −100 °C (212 °F).[5][6] Because of that, it has been practically the only place on Earth to have experienced little-to-no warming caused by greenhouse gas emissions in the recent years.[4]
The East Antarctic ice sheet is most likely to first see sustained losses of ice at its most vulnerable locations such as Totten Glacier and Wilkes Basin. Those areas are sometimes collectively described as East Antarctica's subglacial basins, and it is believed that once the warming reaches around 3 °C (5.4 °F), then they would start to collapse over a period of around 2,000 years,[7][8] This collapse would ultimately add between 1.4 m (4 ft 7 in) and 6.4 m (21 ft 0 in) to sea levels, depending on the ice sheet model used.[9] The EAIS as a whole holds enough ice to raise global sea levels by 53.3 m (175 ft).[2] However, it would take global warming in a range between 5 °C (9.0 °F) and 10 °C (18 °F), and a minimum of 10,000 years for the entire ice sheet to be lost.[7][8]
Description

East Antarctic Ice Sheet is located directly above the East Antarctic Shield - a craton (stable area of the Earth's crust) with the area of 10,200,000 km2 (3,900,000 sq mi), which accounts for around 73% of the entire Antarctic landmass.[10] East Antarctica is separate from West Antarctica due to the presence of Transantarctic Mountains, which span nearly 3,500 km (2,200 mi) from the Weddell Sea to the Ross Sea, and have a width of 100–300 km (62–186 mi).[1]
The ice sheet has an average thickness of around 2.2 km (1.4 mi). The thickest ice in Antarctica is located near Adelie Land close to the ice sheet's southeast coast, at the Astrolabe Subglacial Basin, where it measured 4,897 m (16,066 ft) around 2013.[1][2] Much of the ice sheet is already located at a high elevation: in particular, Dome Argus Plateau has an average height of around 4 km (2.5 mi), and yet it is underlain by the Gamburtsev Mountain Range, which has the average height of 2.7 km (1.7 mi) and is about equivalent in size to the European Alps.[11][12] Consequently, the ice thickness over these mountains ranges from around 1 km (0.62 mi) over their peaks to about 3 km (1.9 mi) over the valleys.[13]

These high elevations are an important reason for why the ice sheet is the driest, windiest, and coldest place on Earth. Dome A in particular sets reported cold temperature records of nearly −100 °C (212 °F).[5][6][4] The only ice-free areas of East Antarctica are where there is too little annual precipitation to form an ice layer, which is the case in the so-called Dry Valleys of the Southern Victoria Land. Another exception are the subglacial lakes, which occur so deep beneath the ice that the pressure melting point is well below 0 °C (32 °F).[13]
Many countries have made territorial claims in Antarctica. Within EAIS, the United Kingdom, France, Norway, Australia, Chile and Argentina all claim a portion (sometimes overlapping) as their own territory.[14]
Geologic history

While relatively small glaciers and ice caps are known to have been present in Antarctica since at least the time of Late Palaeocene, 60 million years ago,[15] a proper ice sheet did not begin to form until the Eocene–Oligocene extinction event about 34 million years ago, when the atmospheric CO2 levels fell to below 750 parts per million. It was initially unstable, and did not grow to consistently cover the entire continent until 32.8 million years ago, when the CO2 levels had further declined to below 600 ppm.[3]
Afterwards, the East Antarctic Ice Sheet declined substantially during the Middle Miocene Climatic Optimum 15 million years ago, yet started to recover about 13.96 million years ago.[15] Since then, it had been largely stable, experiencing "minimal" change in its surface extent over the past 8 million years.[16] While it had still thinned by at least 500 m (1,600 ft) during the Pleistocene period, and by less than 50 m (160 ft) since Last Glacial Maximum, the land area covered by ice in East Antarctica remained largely the same.[17] Contrastingly, the smaller West Antarctic ice sheet is thought to have largely collapsed as recently as during the Eemian period, about 125,000 years ago.[18][19][20][21][22]
Recent climate change

Because East Antarctica is already cooler than West Antarctica, and is also located at substantially greater elevation,[4] it had been less sensitive to climate change, and had actually experienced cooling in the the 1980s and 1990s, even as the West Antarctic Ice Sheet has warmed by more than 0.1 °C/decade since the 1950s.[24] After 2000, the trend had reversed due to local changes in atmospheric circulation: the warming of West Antarctica locations slowed or partially reversed between 2000 and 2020, while the East Antarctica interior had demonstated clear warming. This change in circulation had occurred partly due to natural variability, and partly as the result of the ozone layer beginning to recover following the Montreal Protocol.[23][25] The continent-wide average surface temperature trend of Antarctica is positive and statistically significant at >0.05 °C/decade since 1957.[24]

The limited warming and already low temperatures over East Antarctica mean that as of early 2020s, the majority of observational evidence shows it continuing to gain mass.[27][28][29][30] for instance, GRACE satellite data indicated East Antarctica mass gain of 60 ± 13 billion tons per year between 2002 to 2010.[27] Some analyses have suggested it already begun to lose mass in 2000s,[31][32], but they over-extrapolated some observed losses onto the poorly-observed areas, and a more complete observational record shows continued mass gain.[29]

Because it is currently gaining mass, East Antarctic Ice Sheet is not expected to play a role in the 21st century sea level rise. However, it is still subject to adverse change, such as the retreat of Denman Glacier,[26][34] or the flow of warmer ocean current into ice cavities beneath the stabilizing ice shelves like the Fimbulisen ice shelf in the Queen Maud Land.[35] If global warming were to reach higher levels, then the EAIS would play an increasingly larger role in sea level rise occurring after 2100. According to the most recent reports of the Intergovernmental Panel on Climate Change (SROCC and the IPCC Sixth Assessment Report), the most intense climate change scenario, where the anthropogenic emissions increase continuously, RCP8.5, would result in Antarctica alone losing a median of 1.46 m (4 ft 9 in) (confidence interval between 60 cm (2.0 ft) and 2.89 m (9 ft 6 in)), which would involve some loss from the EAIS in addition to the erosion of the WAIS. This Antarctica-only sea level rise would be in addition to ice losses from the Greenland ice sheet and mountain glaciers, as well as the thermal expansion of ocean water.[36]
Long-term future

If the warming were to remain at elevated levels for a long time, the East Antarctic Ice Sheet would eventually become the dominant contributor to sea level rise, simply because it contains far more ice than any other large ice mass. First, though, it would see sustained erosion at the so-called subglacial basins, such as Totten Glacier and Wilkes Basin, which are located in vulnerable locations below the sea level. Estimates suggest that they would be committed to disappearance once the global warming reaches 3 °C (5.4 °F), although the plausible temperature range is between 2 °C (3.6 °F) and 6 °C (11 °F). Once it becomes too warm for these subglacial basins, their collapse would unfold over a period of around 2,000 years, although it may be as fast as 500 years or as slow as 10,000 years.[7][8] The loss of all this ice would ultimately add between 1.4 m (4 ft 7 in) and 6.4 m (21 ft 0 in) to sea levels, depending on the ice sheet model used. Isostatic rebound of the newly ice-free land would also add 8 cm (3.1 in) and 57 cm (1 ft 10 in), respectively.[9] Evidence from the Pleistocene shows that partial loss can also occur at lower warming levels: Wilkes Basin is estimated to have lost enough ice to add 0.5 m (1 ft 8 in) to sea levels between 115,000 and 129,000 years ago, during the Eemian, and about 0.9 m (2 ft 11 in) between 318,000 and 339,000 years ago, during the Marine Isotope Stage 9.[37]
The entire East Antarctic Ice Sheet holds enough ice to raise global sea levels by 53.3 m (175 ft).[2] Its complete melting is also possible, but it would require very high warming and a lot of time: in 2022, an extensive assessment of tipping points in the climate system published in the Science Magazine concluded that the ice sheet would most likely be committed to complete disappearance only once the global warming reaches about 7.5 °C (13.5 °F), with the minimum and the maximum range between 5 °C (9.0 °F) and 10 °C (18 °F). It would also take a minimum of 10,000 years for the entire ice sheet to be lost. If it were to disappear, then the change in ice-albedo feedback would increase the global temperature by 0.6 °C (1.1 °F), while the regional temperatures would increase by around 2 °C (3.6 °F). The loss of the subglacial basins alone would only add about 0.05 °C (0.090 °F) to global temperatures due to their relatively limited area.[7][8]
See also
References
- ^ a b c Torsvik, T. H.; Gaina, C.; Redfield, T. F. (2008). "Antarctica and Global Paleogeography: From Rodinia, Through Gondwanaland and Pangea, to the Birth of the Southern Ocean and the Opening of Gateways". Antarctica: A Keystone in a Changing World. pp. 125–140. doi:10.17226/12168. ISBN 978-0-309-11854-5.
- ^ a b c d e Fretwell, P.; Pritchard, H. D.; Vaughan, D. G.; Bamber, J. L.; Barrand, N. E.; Bell, R.; Bianchi, C.; Bingham, R. G.; Blankenship, D. D. (2013-02-28). "Bedmap2: improved ice bed, surface and thickness datasets for Antarctica". The Cryosphere. 7 (1): 375–393. Bibcode:2013TCry....7..375F. doi:10.5194/tc-7-375-2013. hdl:1808/18763. ISSN 1994-0424.
- ^ a b Galeotti, Simone; DeConto, Robert; Naish, Timothy; Stocchi, Paolo; Florindo, Fabio; Pagani, Mark; Barrett, Peter; Bohaty, Steven M.; Lanci, Luca; Pollard, David; Sandroni, Sonia; Talarico, Franco M.; Zachos, James C. (10 March 2016). "Antarctic Ice Sheet variability across the Eocene-Oligocene boundary climate transition". Science. 352 (6281): 76–80. doi:10.1126/science.aab066.
- ^ a b c d Singh, Hansi A.; Polvani, Lorenzo M. (10 January 2020). "Low Antarctic continental climate sensitivity due to high ice sheet orography". npj Climate and Atmospheric Science. 3. doi:10.1038/s41612-020-00143-w. S2CID 222179485.
- ^ a b Scambos, T. A.; Campbell, G. G.; Pope, A.; Haran, T.; Muto, A.; Lazzara, M.; Reijmer, C. H.; Van Den Broeke, M. R. (25 June 2018). "Ultralow Surface Temperatures in East Antarctica From Satellite Thermal Infrared Mapping: The Coldest Places on Earth". Geophysical Research Letters. 45 (12): 6124–6133. Bibcode:2018GeoRL..45.6124S. doi:10.1029/2018GL078133. hdl:1874/367883.
- ^ a b Vizcarra, Natasha (25 June 2018). "New study explains Antarctica's coldest temperatures". National Snow and Ice Data Center. Retrieved 10 January 2024.
- ^ a b c d Armstrong McKay, David; Abrams, Jesse; Winkelmann, Ricarda; Sakschewski, Boris; Loriani, Sina; Fetzer, Ingo; Cornell, Sarah; Rockström, Johan; Staal, Arie; Lenton, Timothy (9 September 2022). "Exceeding 1.5°C global warming could trigger multiple climate tipping points". Science. 377 (6611). doi:10.1126/science.abn7950. hdl:10871/131584. ISSN 0036-8075. S2CID 252161375.
- ^ a b c d Armstrong McKay, David (9 September 2022). "Exceeding 1.5°C global warming could trigger multiple climate tipping points – paper explainer". climatetippingpoints.info. Retrieved 2 October 2022.
- ^ a b Pan, Linda; Powell, Evelyn M.; Latychev, Konstantin; Mitrovica, Jerry X.; Creveling, Jessica R.; Gomez, Natalya; Hoggard, Mark J.; Clark, Peter U. (30 April 2021). "Rapid postglacial rebound amplifies global sea level rise following West Antarctic Ice Sheet collapse". Science Advances. 7 (18). doi:10.1126/sciadv.abf7787.
- ^ Drewry, David J. (November 1976). "Sedimentary basins of the east antarctic craton from geophysical evidence". Tectonophysics. 36 (1–3): 301–314. Bibcode:1976Tectp..36..301J. doi:10.1016/0040-1951(76)90023-8.
- ^ Sara E. Pratt (6 February 2012). "Unearthing Antarctica's mysterious mountains". Earth Magazine. Retrieved 15 January 2024.
- ^ Robin Bell (12 November 2008). "Dispatches from the Bottom of the Earth: An Antarctic Expedition in Search of Large Mountains Encased in Ice". Scientific American. Retrieved 15 January 2024.
- ^ a b Davies, Bethan (22 June 2020). "East Antarctic Ice Sheet". AntarcticGlaciers.org.
- ^ Bush, W. M. (October 1989). "Antarctica and international law: a collection of inter-state and national documents". American Journal of International Law. 83 (4): 959–964. doi:10.2307/2203393. ISBN 978-0-379-20321-9.
- ^ a b Barr, Iestyn D.; Spagnolo, Matteo; Rea, Brice R.; Bingham, Robert G.; Oien, Rachel P.; Adamson, Kathryn; Ely, Jeremy C.; Mullan, Donal J.; Pellitero, Ramón; Tomkins, Matt D. (21 September 2022). "60 million years of glaciation in the Transantarctic Mountains". Nature Communications. 13 (1): 5526. doi:10.1038/s41467-022-33310-z. hdl:2164/19437. ISSN 2041-1723.
- ^ Shakun, Jeremy D.; et al. (2018). "Minimal East Antarctic Ice Sheet retreat onto land during the past eight million years". Nature. 558 (7709): 284–287. Bibcode:2018Natur.558..284S. doi:10.1038/s41586-018-0155-6. OSTI 1905199. PMID 29899483. S2CID 49185845.
- ^ Yusuke Suganuma; Hideki Miura; Albert Zondervan; Jun'ichi Okuno (August 2014). "East Antarctic deglaciation and the link to global cooling during the Quaternary: evidence from glacial geomorphology and 10Be surface exposure dating of the Sør Rondane Mountains, Dronning Maud Land". Quaternary Science Reviews. 97: 102–120. Bibcode:2014QSRv...97..102S. doi:10.1016/j.quascirev.2014.05.007.
- ^ Voosen, Paul (2018-12-18). "Discovery of recent Antarctic ice sheet collapse raises fears of a new global flood". Science. Retrieved 2018-12-28.
- ^ Turney, Chris S. M.; Fogwill, Christopher J.; Golledge, Nicholas R.; McKay, Nicholas P.; Sebille, Erik van; Jones, Richard T.; Etheridge, David; Rubino, Mauro; Thornton, David P.; Davies, Siwan M.; Ramsey, Christopher Bronk (2020-02-11). "Early Last Interglacial ocean warming drove substantial ice mass loss from Antarctica". Proceedings of the National Academy of Sciences. 117 (8): 3996–4006. Bibcode:2020PNAS..117.3996T. doi:10.1073/pnas.1902469117. ISSN 0027-8424. PMC 7049167. PMID 32047039.
- ^ Carlson, Anders E; Walczak, Maureen H; Beard, Brian L; Laffin, Matthew K; Stoner, Joseph S; Hatfield, Robert G (10 December 2018). Absence of the West Antarctic ice sheet during the last interglaciation. American Geophysical Union Fall Meeting.
- ^ Lau, Sally C. Y.; Wilson, Nerida G.; Golledge, Nicholas R.; Naish, Tim R.; Watts, Phillip C.; Silva, Catarina N. S.; Cooke, Ira R.; Allcock, A. Louise; Mark, Felix C.; Linse, Katrin (21 December 2023). "Genomic evidence for West Antarctic Ice Sheet collapse during the Last Interglacial". Science. 382 (6677): 1384–1389. doi:10.1126/science.ade0664.
- ^ AHMED, Issam. "Antarctic octopus DNA reveals ice sheet collapse closer than thought". phys.org. Retrieved 2023-12-23.
- ^ a b Xin, Meijiao; Clem, Kyle R; Turner, John; Stammerjohn, Sharon E; Zhu, Jiang; Cai, Wenju; Li, Xichen (2 June 2023). "West-warming East-cooling trend over Antarctica reversed since early 21st century driven by large-scale circulation variation". Environmental Research Letters. 18 (6): 064034. doi:10.1088/1748-9326/acd8d4.
- ^ a b Steig, E. J.; Schneider, D. P.; Rutherford, S. D.; Mann, M. E.; Comiso, J. C.; Shindell, D. T. (2009). "Warming of the Antarctic ice-sheet surface since the 1957 International Geophysical Year". Nature. 457 (7228): 459–462. Bibcode:2009Natur.457..459S. doi:10.1038/nature07669. PMID 19158794. S2CID 4410477.
- ^ Xin, Meijiao; Li, Xichen; Stammerjohn, Sharon E; Cai, Wenju; Zhu, Jiang; Turner, John; Clem, Kyle R; Song, Chentao; Wang, Wenzhu; Hou, Yurong (17 May 2023). "A broadscale shift in antarctic temperature trends". Climate Dynamics. 61: 4623–4641. doi:10.1007/s00382-023-06825-4.
- ^ a b Brancato, V.; Rignot, E.; Milillo, P.; Morlighem, M.; Mouginot, J.; An, L.; Scheuchl, B.; Jeong, S.; Rizzoli, P.; Bueso Bello, J.L.; Prats-Iraola, P. (2020). "Grounding line retreat of Denman Glacier, East Antarctica, measured with COSMO-SkyMed radar interferometry data". Geophysical Research Letters. 47 (7): e2019GL086291. Bibcode:2020GeoRL..4786291B. doi:10.1029/2019GL086291. ISSN 0094-8276.
- ^ a b King, M. A.; Bingham, R. J.; Moore, P.; Whitehouse, P. L.; Bentley, M. J.; Milne, G. A. (2012). "Lower satellite-gravimetry estimates of Antarctic sea-level contribution". Nature. 491 (7425): 586–589. Bibcode:2012Natur.491..586K. doi:10.1038/nature11621. PMID 23086145. S2CID 4414976.
- ^ IMBIE team (13 June 2018). "Mass balance of the Antarctic Ice Sheet from 1992 to 2017". Nature. 558 (7709): 219–222. Bibcode:2018Natur.558..219I. doi:10.1038/s41586-018-0179-y. hdl:2268/225208. PMID 29899482. S2CID 49188002.
- ^ a b Zwally, H. Jay; Robbins, John W.; Luthcke, Scott B.; Loomis, Bryant D.; Rémy, Frédérique (29 March 2021). "Mass balance of the Antarctic ice sheet 1992–2016: reconciling results from GRACE gravimetry with ICESat, ERS1/2 and Envisat altimetry". Journal of Glaciology. 67 (263): 533–559. doi:10.1017/jog.2021.8.
Although their methods of interpolation or extrapolation for areas with unobserved output velocities have an insufficient description for the evaluation of associated errors, such errors in previous results (Rignot and others, 2008) caused large overestimates of the mass losses as detailed in Zwally and Giovinetto (Zwally and Giovinetto, 2011).
- ^ NASA (7 July 2023). "Antarctic Ice Mass Loss 2002-2023".
- ^ Chen, J. L.; Wilson, C. R.; Blankenship, D.; Tapley, B. D. (2009). "Accelerated Antarctic ice loss from satellite gravity measurements". Nature Geoscience. 2 (12): 859. Bibcode:2009NatGe...2..859C. doi:10.1038/ngeo694. S2CID 130927366.
- ^ Rignot, Eric; Mouginot, Jérémie; Scheuchl, Bernd; van den Broeke, Michiel; van Wessem, Melchior J.; Morlighem, Mathieu (22 January 2019). "Four decades of Antarctic Ice Sheet mass balance from 1979–2017". Proceedings of the National Academy of Sciences. 116 (4): 1095–1103. Bibcode:2019PNAS..116.1095R. doi:10.1073/pnas.1812883116. PMC 6347714. PMID 30642972.
- ^ a b "Anticipating Future Sea Levels". EarthObservatory.NASA.gov. National Aeronautics and Space Administration (NASA). 2021. Archived from the original on 7 July 2021.
- ^ Amos, Jonathan (2020-03-23). "Climate change: Earth's deepest ice canyon vulnerable to melting". BBC.
- ^ Lauber, Julius; Hattermann, Torr; de Steur, Laura; Darelius, Elin; Auger, Matthis; Anders Nost, Ole; Moholdt, Geir (21 September 2023). "Warming beneath an East Antarctic ice shelf due to increased subpolar westerlies and reduced sea ice". Nature Geoscience. 16: 877–885.
- ^ Fox-Kemper, B.; Hewitt, H.T.; Xiao, C.; Aðalgeirsdóttir, G.; Drijfhout, S.S.; Edwards, T.L.; Golledge, N.R.; Hemer, M.; Kopp, R.E.; Krinner, G.; Mix, A. (2021). Masson-Delmotte, V.; Zhai, P.; Pirani, A.; Connors, S.L.; Péan, C.; Berger, S.; Caud, N.; Chen, Y.; Goldfarb, L. (eds.). "Chapter 9: Ocean, Cryosphere and Sea Level Change" (PDF). Climate Change 2021: The Physical Science Basis. Contribution of Working Group I to the Sixth Assessment Report of the Intergovernmental Panel on Climate Change. Cambridge University Press, Cambridge, UK and New York, NY, USA: 1270–1272.
- ^ a b Crotti, Ilaria; Quiquet, Aurélien; Landais, Amaelle; Stenni, Barbara; Wilson, David J.; Severi, Mirko; Mulvaney, Robert; Wilhelms, Frank; Barbante, Carlo; Frezzotti, Massimo (10 September 2022). "Wilkes subglacial basin ice sheet response to Southern Ocean warming during late Pleistocene interglacials". Nature Communications. 13: 5328. doi:10.1038/s41467-022-32847-3.