
List of Irish counties by population: Difference between revisions
Content deleted Content added
m update % increase |
Trikipedian (talk | contribs) Adding average change per difference in Census years |
||
| Line 25: | Line 25: | ||
!scope="col"| Traditional province |
!scope="col"| Traditional province |
||
!scope="col"| Change since <br /> previous census |
!scope="col"| Change since <br /> previous census |
||
!scope="col"| Change per year |
|||
|- |
|- |
||
| align=right | 1 |
| align=right | 1 |
||
| Line 32: | Line 33: | ||
| Leinster |
| Leinster |
||
| {{increase|}} '''7.7%''' |
| {{increase|}} '''7.7%''' |
||
| {{increase|}} '''1.28%''' |
|||
|- |
|- |
||
| align=right | 2 |
| align=right | 2 |
||
| Line 39: | Line 41: | ||
| Ulster |
| Ulster |
||
| {{increase|}} '''1.8%''' |
| {{increase|}} '''1.8%''' |
||
| {{increase|}} '''0.18%''' |
|||
|- |
|- |
||
| align=right | 3 |
| align=right | 3 |
||
| Line 46: | Line 49: | ||
| Munster |
| Munster |
||
| {{increase|}} '''7.1%''' |
| {{increase|}} '''7.1%''' |
||
| {{increase|}} '''1.18%''' |
|||
|- |
|- |
||
| align=right | 4 |
| align=right | 4 |
||
| Line 53: | Line 57: | ||
| Ulster |
| Ulster |
||
| {{increase|}} '''8.7%''' |
| {{increase|}} '''8.7%''' |
||
| {{increase|}} '''0.87%''' |
|||
|- style="background:#f5f5d3;" |
|- style="background:#f5f5d3;" |
||
| align=right | – |
| align=right | – |
||
| Line 60: | Line 65: | ||
| Leinster |
| Leinster |
||
| {{increase|}} '''11.2%''' |
| {{increase|}} '''11.2%''' |
||
| {{increase|}} '''1.86%''' |
|||
|- style="background:#f5f5d3;" |
|- style="background:#f5f5d3;" |
||
| align=right | – |
| align=right | – |
||
| Line 67: | Line 73: | ||
| Leinster |
| Leinster |
||
| {{increase|}} '''7.5%''' |
| {{increase|}} '''7.5%''' |
||
| {{increase|}} '''1.25%''' |
|||
|- |
|- |
||
| align=right | 5 |
| align=right | 5 |
||
| Line 74: | Line 81: | ||
| Connacht |
| Connacht |
||
| {{increase|}} '''7.1%''' |
| {{increase|}} '''7.1%''' |
||
| {{increase|}} '''1.18%''' |
|||
|- |
|- |
||
| align=right | 6 |
| align=right | 6 |
||
| Line 81: | Line 89: | ||
| Ulster |
| Ulster |
||
| {{increase|}} '''4.8%''' |
| {{increase|}} '''4.8%''' |
||
| {{increase|}} '''0.48%''' |
|||
|- |
|- |
||
| align=right | 7 |
| align=right | 7 |
||
| Line 88: | Line 97: | ||
| Leinster |
| Leinster |
||
| {{increase|}} '''11.0%''' |
| {{increase|}} '''11.0%''' |
||
| {{increase|}} '''1.83%''' |
|||
|- style="background:#f5f5d3;" |
|- style="background:#f5f5d3;" |
||
| align=right | – |
| align=right | – |
||
| Line 95: | Line 105: | ||
| Leinster |
| Leinster |
||
| {{increase|}} '''7.1%''' |
| {{increase|}} '''7.1%''' |
||
| {{increase|}} '''1.18%''' |
|||
|- |
|- |
||
| align=right | 8 |
| align=right | 8 |
||
| Line 102: | Line 113: | ||
|Leinster |
|Leinster |
||
| {{increase|}} '''12.9%''' |
| {{increase|}} '''12.9%''' |
||
| {{increase|}} '''2.15%''' |
|||
|- |
|- |
||
| align=right | 9 |
| align=right | 9 |
||
| Line 109: | Line 121: | ||
| Munster |
| Munster |
||
| {{increase|}} '''5.4%''' |
| {{increase|}} '''5.4%''' |
||
| {{increase|}} '''0.9%''' |
|||
|- |
|- |
||
| align=right | 10 |
| align=right | 10 |
||
| Line 116: | Line 129: | ||
| Ulster |
| Ulster |
||
| {{increase|}} '''8.4%''' |
| {{increase|}} '''8.4%''' |
||
| {{increase|}} '''0.84%''' |
|||
|- |
|- |
||
| align=right | 11 |
| align=right | 11 |
||
| Line 123: | Line 137: | ||
| Ulster |
| Ulster |
||
| {{increase|}} '''7.3%''' |
| {{increase|}} '''7.3%''' |
||
| {{increase|}} '''0.73%''' |
|||
|- |
|- |
||
| align=right | 12 |
| align=right | 12 |
||
| Line 130: | Line 145: | ||
| Munster |
| Munster |
||
| {{increase|}} '''5.1%''' |
| {{increase|}} '''5.1%''' |
||
| {{increase|}} '''0.85%''' |
|||
|- |
|- |
||
| align=right | 13 |
| align=right | 13 |
||
| Line 137: | Line 153: | ||
| Ulster |
| Ulster |
||
| {{increase|}} '''4.5%''' |
| {{increase|}} '''4.5%''' |
||
| {{increase|}} '''0.75%''' |
|||
|- |
|- |
||
| align=right | 14 |
| align=right | 14 |
||
| Line 144: | Line 161: | ||
|Leinster |
|Leinster |
||
| {{increase|}} '''9.2%''' |
| {{increase|}} '''9.2%''' |
||
| {{increase|}} '''1.53%''' |
|||
|- |
|- |
||
| align=right | 15 |
| align=right | 15 |
||
| Line 151: | Line 169: | ||
|Leinster |
|Leinster |
||
| {{increase|}} '''9.2%''' |
| {{increase|}} '''9.2%''' |
||
| {{increase|}} '''1.53%''' |
|||
|- |
|- |
||
| align=right | 16 |
| align=right | 16 |
||
| Line 158: | Line 177: | ||
| Munster |
| Munster |
||
| {{increase|}} '''5.1%''' |
| {{increase|}} '''5.1%''' |
||
| {{increase|}} '''0.85%''' |
|||
|- |
|- |
||
| align=right | 17 |
| align=right | 17 |
||
| Line 165: | Line 185: | ||
|Leinster |
|Leinster |
||
| {{increase|}} '''7.9%''' |
| {{increase|}} '''7.9%''' |
||
| {{increase|}} '''1.31%''' |
|||
|- |
|- |
||
| align=right | 18 |
| align=right | 18 |
||
| Line 172: | Line 193: | ||
|Connacht |
|Connacht |
||
| {{increase|}} '''5.2%''' |
| {{increase|}} '''5.2%''' |
||
| {{increase|}} '''0.87%''' |
|||
|- |
|- |
||
| align=right | 19 |
| align=right | 19 |
||
| Line 179: | Line 201: | ||
| Munster |
| Munster |
||
| {{increase|}} '''7.2%''' |
| {{increase|}} '''7.2%''' |
||
| {{increase|}} '''1.2%''' |
|||
|- |
|- |
||
| align=right | 20 |
| align=right | 20 |
||
| Line 186: | Line 209: | ||
| Munster |
| Munster |
||
| {{increase|}} '''9.4%''' |
| {{increase|}} '''9.4%''' |
||
| {{increase|}} '''1.57%''' |
|||
|- |
|- |
||
| align=right | 21 |
| align=right | 21 |
||
| Line 193: | Line 217: | ||
|Leinster |
|Leinster |
||
| {{increase|}} '''4.5%''' |
| {{increase|}} '''4.5%''' |
||
| {{increase|}} '''0.75%''' |
|||
|- |
|- |
||
| align=right | 22 |
| align=right | 22 |
||
| Line 200: | Line 225: | ||
|Leinster |
|Leinster |
||
| {{increase|}} '''8.0%''' |
| {{increase|}} '''8.0%''' |
||
| {{increase|}} '''1.33%''' |
|||
|- |
|- |
||
| align=right | 23 |
| align=right | 23 |
||
| Line 207: | Line 233: | ||
|Leinster |
|Leinster |
||
| {{increase|}} '''8.2%''' |
| {{increase|}} '''8.2%''' |
||
| {{increase|}} '''1.37%''' |
|||
|- |
|- |
||
| align=right | 24 |
| align=right | 24 |
||
| Line 214: | Line 241: | ||
|Leinster |
|Leinster |
||
| {{increase|}} '''6.0%''' |
| {{increase|}} '''6.0%''' |
||
| {{increase|}} '''1.0%''' |
|||
|- |
|- |
||
| align=right | 25 |
| align=right | 25 |
||
| Line 221: | Line 249: | ||
| Ulster |
| Ulster |
||
| {{increase|}} '''6.6%''' |
| {{increase|}} '''6.6%''' |
||
| {{increase|}} '''1.1%''' |
|||
|- |
|- |
||
| align=right | 26 |
| align=right | 26 |
||
| Line 228: | Line 257: | ||
| Connacht |
| Connacht |
||
| {{increase|}} '''8.4%''' |
| {{increase|}} '''8.4%''' |
||
| {{increase|}} '''1.4%''' |
|||
|- |
|- |
||
| align=right | 27 |
| align=right | 27 |
||
| Line 235: | Line 265: | ||
| Connacht |
| Connacht |
||
| {{increase|}} '''6.5%''' |
| {{increase|}} '''6.5%''' |
||
| {{increase|}} '''1.08%''' |
|||
|- |
|- |
||
| align=right | 28 |
| align=right | 28 |
||
| Line 242: | Line 273: | ||
| Ulster |
| Ulster |
||
| {{increase|}} '''5.6%''' |
| {{increase|}} '''5.6%''' |
||
| {{increase|}} '''0.93%''' |
|||
|- |
|- |
||
| align=right | 29 |
| align=right | 29 |
||
| Line 249: | Line 281: | ||
| Ulster |
| Ulster |
||
| {{increase|}} '''6.3%''' |
| {{increase|}} '''6.3%''' |
||
| {{increase|}} '''0.63%''' |
|||
|- |
|- |
||
| align=right | 30 |
| align=right | 30 |
||
| Line 256: | Line 289: | ||
| Leinster |
| Leinster |
||
| {{increase|}} '''8.8%''' |
| {{increase|}} '''8.8%''' |
||
| {{increase|}} '''1.47%''' |
|||
|- |
|- |
||
| align=right | 31 |
| align=right | 31 |
||
| Line 263: | Line 297: | ||
| Leinster |
| Leinster |
||
| {{increase|}} '''14.1%''' |
| {{increase|}} '''14.1%''' |
||
| {{increase|}} '''2.35%''' |
|||
|- |
|- |
||
| align=right | 32 |
| align=right | 32 |
||
| Line 270: | Line 305: | ||
| Connacht |
| Connacht |
||
| {{increase|}} '''9.5%''' |
| {{increase|}} '''9.5%''' |
||
| {{increase|}} '''1.58%''' |
|||
|- |
|- |
||
! Total |
! Total |
||
Revision as of 16:17, 16 July 2022
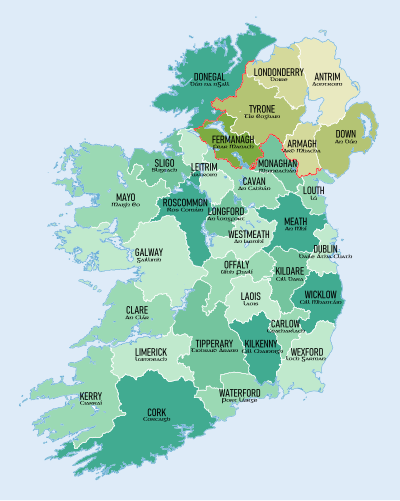
This is a list of counties of Ireland ordered by population. Counties in the Republic of Ireland are shown in normal type, while those in Northern Ireland are listed in italic type. Non-traditional administrative counties are indicated by a cream-coloured background.
For a more detailed analysis of current and historical Irish populations in the Republic of Ireland, see Irish population analysis. The population of the six counties of Northern Ireland as of 2021 is 1,903,100[1] which would mean a total population on the island of Ireland as of 2016 of approximately 7,026,636
Data source (as of June 2022):
- Taken from latest census data for the Republic of Ireland[2] and Northern Ireland.[failed verification]
- Population data for counties in the Republic of Ireland is based on preliminary data from census of 2022.
- Population data for counties in Northern Ireland is based on census of 2011.
- The previous census for the Republic of Ireland was taken in 2016, the previous census for Northern Ireland was taken in 2001.
- Density updated as of 2016
| Rank | County | Population | Density (km²) | Traditional province | Change since previous census |
Change per year |
|---|---|---|---|---|---|---|
| 1 | Dublin | 1,450,701 | 1,573.4 | Leinster | ||
| 2 | Antrim | 618,108 | 202.9 | Ulster | ||
| 3 | Cork | 581,231 | 72.3 | Munster | ||
| 4 | Down | 531,665 | 215.6 | Ulster | ||
| – | Fingal | 329,218 | 721.9 | Leinster | ||
| – | South Dublin | 299,793 | 1,345.9 | Leinster | ||
| 5 | Galway | 276,451 | 42.0 | Connacht | ||
| 6 | Londonderry | 247,132 | 119.1 | Ulster | ||
| 7 | Kildare | 246,977 | 131.0 | Leinster | ||
| – | Dún Laoghaire–Rathdown | 233,457 | 1,855.8 | Leinster | ||
| 8 | Meath | 220,296 | 83.2 | Leinster | ||
| 9 | Limerick | 205,444 | 70.8 | Munster | ||
| 10 | Tyrone | 179,000 | 54.5 | Ulster | ||
| 11 | Armagh | 174,792 | 131.8 | Ulster | ||
| 12 | Tipperary | 167,661 | 37.2 | Munster | ||
| 13 | Donegal | 166,321 | 32.6 | Ulster | ||
| 14 | Wexford | 163,527 | 63.2 | Leinster | ||
| 15 | Wicklow | 155,485 | 70.2 | Leinster | ||
| 16 | Kerry | 155,258 | 30.7 | Munster | ||
| 17 | Louth | 139,100 | 155.4 | Leinster | ||
| 18 | Mayo | 137,231 | 23.3 | Connacht | ||
| 19 | Clare | 127,419 | 34.4 | Munster | ||
| 20 | Waterford | 127,085 | 62.7 | Munster | ||
| 21 | Kilkenny | 103,685 | 47.8 | Leinster | ||
| 22 | Westmeath | 95,840 | 48.2 | Leinster | ||
| 23 | Laois | 91,657 | 49.3 | Leinster | ||
| 24 | Offaly | 82,668 | 38.9 | Leinster | ||
| 25 | Cavan | 81,201 | 39.3 | Ulster | ||
| 26 | Roscommon | 69,995 | 25.3 | Connacht | ||
| 27 | Sligo | 69,819 | 35.5 | Connacht | ||
| 28 | Monaghan | 64,832 | 47.3 | Ulster | ||
| 29 | Fermanagh | 61,170 | 36.1 | Ulster | ||
| 30 | Carlow | 61,931 | 63.4 | Leinster | ||
| 31 | Longford | 46,634 | 37.4 | Leinster | ||
| 32 | Leitrim | 35,087 | 20.1 | Connacht | ||
| Total | Island of Ireland | 7,026,636 | 77.8 | |||
| Average | 205,429 |
See also
- Demographics of the Republic of Ireland
- Irish Population Analysis
- List of Irish counties by area
- List of Irish counties by highest point
- List of Irish counties by coastline
Notes
- The populations of Dublin, Cork, Galway, Limerick and Waterford cities have been added to their respective traditional counties. For a list of these cities by population see, List of towns in the Republic of Ireland by population. For more information on city status, see City status in Ireland.
References
- ^ "Archived copy" (PDF). Archived from the original (PDF) on 24 December 2012. Retrieved 16 December 2014.
{{cite web}}: CS1 maint: archived copy as title (link) NISRA Key Report, 2011 - ^ [1] Central Statistics Office figures