Time domain
This article needs additional citations for verification. (August 2012) |

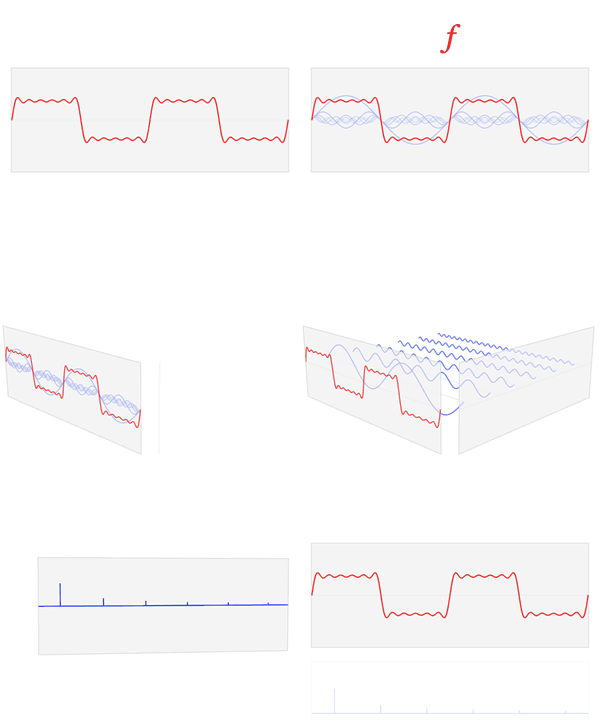
Time domain refers to the analysis of mathematical functions, physical signals or time series of economic or environmental data, with respect to time. In the time domain, the signal or function's value is known for all real numbers, for the case of continuous time, or at various separate instants in the case of discrete time. An oscilloscope is a tool commonly used to visualize real-world signals in the time domain. A time-domain graph shows how a signal changes with time, whereas a frequency-domain graph shows how much of the signal lies within each given frequency band over a range of frequencies.
Origin of term
The use of the contrasting terms time domain and frequency domain developed in U.S. communication engineering in the late 1940s, with the terms appearing together without definition by 1950.[1] When an analysis uses the second or one of its multiples as a unit of measurement, then it is in the time domain. When analysis concerns the reciprocal units such as Hertz, then it is in the frequency domain.
See also
References
- ^ Lee, Y. W.; Cheatham, T. P., Jr.; Wiesner, J. B. (1950). "Application of Correlation Analysis to the Detection of Periodic Signals in Noise". Proceedings of the IRE. 38 (10): 1165–1171. doi:10.1109/JRPROC.1950.233423.
{{cite journal}}: CS1 maint: multiple names: authors list (link)
