From Wikipedia, the free encyclopedia
Austrian legislative election, 1990|
|
|
|
|
First party
|
Second party
|
|
|

|

|
| Leader
|
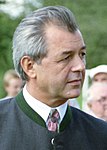
Franz Vranitzky
|
Josef Riegler
|
| Party
|
SPÖ
|
ÖVP
|
| Leader since
|
1988
|
1989
|
| Last election
|
80 seats, 43.11%
|
77 seats, 41.29%
|
| Seats won
|
80
|
60
|
| Seat change
|
0
|
 17 17
|
| Popular vote
|
2,012,787
|
1,508,600
|
| Percentage
|
42.78%
|
32.07%
|
| Swing
|
 0.33% 0.33%
|
 9.22% 9.22%
|
|
|
|
Third party
|
Fourth party
|
|
|

|

|
| Leader
|
Jörg Haider
|
Johannes Voggenhuber
|
| Party
|
FPÖ
|
Greens
|
| Leader since
|
1986
|
1988
|
| Last election
|
18 seats, 9.73%
|
8 seats, 4.82%
|
| Seats won
|
33
|
10
|
| Seat change
|
 15 15
|
 2 2
|
| Popular vote
|
782,648
|
225,084
|
| Percentage
|
16.64%
|
4.78%
|
| Swing
|
 6.91% 6.91%
|
 0.04% 0.04%
|
|
|
Parliamentary elections were held in Austria on 7 October 1990.[1] The Social Democratic Party won the most seats, and retained the grand coalition with the Austrian People's Party. Voter turnout was 86.1%.[2]
Results
| Party
|
Votes
|
%
|
Seats
|
+/–
|
| Socialist Party |
2,012,787 |
42.8 |
80 |
0
|
| Austrian People's Party |
1,508,600 |
32.1 |
60 |
–17
|
| Freedom Party of Austria |
782,648 |
16.6 |
33 |
+15
|
| Green Alternative-Freda Meissner-Blau List |
225,084 |
4.8 |
10 |
+2
|
| United Greens of Austria |
92,277 |
2.0 |
0 |
0
|
| Alliance of Welfare Beneficiaries |
35,833 |
0.8 |
0 |
New
|
| Communist Party of Austria |
25,682 |
0.5 |
0 |
0
|
| Christian Electoral Community |
9,263 |
0.2 |
0 |
New
|
| Christian Democratic Party |
6,194 |
0.1 |
0 |
New
|
| Grey Austrians' Election Platform |
3,996 |
0.1 |
0 |
New
|
| Fritz Georg |
2,530 |
0.1 |
0 |
New
|
| Invalid/blank votes |
143,847 |
– |
– |
–
|
| Total |
4,848,741 |
100 |
183 |
0
|
| Source: Nohlen & Stöver
|
| Popular vote |
|---|
|
|
|
| SPÖ |
|
42.78% |
| ÖVP |
|
32.07% |
| FPÖ |
|
16.64% |
| GRÜNE |
|
4.78% |
| VGÖ |
|
1.96% |
| Other |
|
1.77% |
|
| Parliamentary seats |
|---|
|
|
|
| SPÖ |
|
43.72% |
| ÖVP |
|
32.79% |
| FPÖ |
|
18.03% |
| GRÜNE |
|
5.46% |
|
References


