From Wikipedia, the free encyclopedia
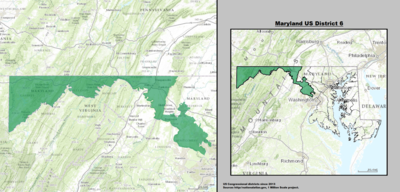
Maryland's 6th congressional district Maryland's 6th congressional district - since January 3, 2013.
Representative Cook PVI D+4[ 1]
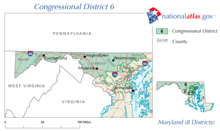
Maryland's 6th congressional district elects a representative to the United States House of Representatives from the northwest part of the state. Today the district comprises all of Garrett , Allegany , and Washington counties as well as portions of Montgomery and Frederick counties. The seat is currently represented by John Delaney (D ).
History
The Maryland 6th District was one of the original districts that had a congressman starting in 1789. At that time, the district essentially had what remains its modern boundaries, consisting of the Maryland panhandle and areas eastward, all the way to the modern western boundary of the District of Columbia . However after the 1790 census Maryland's representation increased to 8 congresspersons. The new sixth district was in the north-east corner of the state east of Baltimore, covering essentially the modern counties of Harford , Cecil and Kent .[ 2]
In 2012 the district was found to be the ninth least compact congressional district in the United States.[ 3]
Recent elections
List of representatives
Representative
Took office
Left office
Party
Notes/Events
1
File:Daniel carroll.jpg Daniel Carroll March 4, 1789
March 3, 1791
Pro-Administration
2
Upton Sheredine March 4, 1791
March 3, 1793
Anti-Administration
3
Gabriel Christie
March 4, 1793
March 3, 1795
Anti-Administration
March 4, 1795
March 3, 1797
Democratic-Republican
4
William Matthews March 4, 1797
March 3, 1799
Federalist
5
Gabriel Christie March 4, 1799
March 3, 1801
Democratic-Republican
6
John Archer March 4, 1801
March 3, 1807
Democratic-Republican
7
John Montgomery March 4, 1807
April 29, 1811
Democratic-Republican resigned after being appointed Attorney General of Maryland
8
Stevenson Archer October 26, 1811
March 3, 1817
Democratic-Republican
9
Thomas Culbreth March 4, 1817
March 3, 1821
Democratic-Republican
10
Jeremiah Cosden March 4, 1821
March 19, 1822
Democratic-Republican contested election
11
Philip Reed March 19, 1822
March 3, 1823
Democratic-Republican
12
George E. Mitchell
March 4, 1823
March 3, 1825
Adams-Clay DR
March 4, 1825
March 3, 1827
Jacksonian
13
Levin Gale March 4, 1827
March 3, 1829
Jacksonian
14
George E. Mitchell December 7, 1829
June 28, 1832
Jacksonian Died
15
Charles S. Sewall October 1, 1832
March 3, 1833
Jacksonian
16
William C. Johnson March 4, 1833
March 3, 1835
Anti-Jacksonian
17
Francis Thomas
March 4, 1835
March 3, 1837
Jacksonian
Redistricted from the 7th district
March 4, 1837
March 3, 1841
Democratic
18
John T. Mason, Jr. March 4, 1841
March 3, 1843
Democratic
19
Thomas A. Spence March 4, 1843
March 3, 1845
Whig
20
Edward H. C. Long March 4, 1845
March 3, 1847
Whig
21
John W. Crisfield March 4, 1847
March 3, 1849
Whig
22
John B. Kerr March 4, 1849
March 3, 1851
Whig
23
Joseph S. Cottman March 4, 1851
March 3, 1853
Independent Whig
24
Augustus R. Sollers March 4, 1853
March 3, 1855
Whig
25
Thomas F. Bowie March 4, 1855
March 3, 1859
Democratic
26
George W. Hughes March 4, 1859
March 3, 1861
Democratic
27
Charles B. Calvert March 4, 1861
March 3, 1863
Unionist
This seat was abolished after the census of 1860 , but was reinstated after the census of 1870 .
28
Lloyd Lowndes, Jr. March 4, 1873
March 3, 1875
Republican
29
William Walsh March 4, 1875
March 3, 1879
Democratic
30
Milton G. Urner March 4, 1879
March 3, 1883
Republican
31
Louis E. McComas March 4, 1883
March 3, 1891
Republican
32
William M. McKaig March 4, 1891
March 3, 1895
Democratic
33
George Louis Wellington March 4, 1895
March 3, 1897
Republican
34
John McDonald March 4, 1897
March 3, 1899
Republican
35
George A. Pearre March 4, 1899
March 3, 1911
Republican
36
David J. Lewis March 4, 1911
March 3, 1917
Democratic
37
Frederick N. Zihlman March 4, 1917
March 3, 1931
Republican
38
David J. Lewis March 4, 1931
January 3, 1939
Democratic
39
William D. Byron January 3, 1939
February 27, 1941
Democratic Died
40
Katharine Byron May 27, 1941
January 3, 1943
Democratic
41
James G. Beall January 3, 1943
January 3, 1953
Republican
42
DeWitt S. Hyde January 3, 1953
January 3, 1959
Republican
43
John R. Foley January 3, 1959
January 3, 1961
Democratic
44
Charles M. Mathias, Jr. January 3, 1961
January 3, 1969
Republican
45
John G. Beall, Jr. January 3, 1969
January 3, 1971
Republican
46
Goodloe E. Byron January 3, 1971
October 11, 1978
Democratic Died
47
Beverly Butcher Byron January 3, 1979
January 3, 1993
Democratic
48
Roscoe G. Bartlett January 3, 1993
January 3, 2013
Republican
49
John K. Delaney January 3, 2013
Present
Democratic Incumbent
Election Results
1990
1992
1994
1996
1998
2000
2002
2004
2006
2008
2010
2012
2014
Historical district boundaries
2003 - 2013
See also
References
39°42′N 78°06′W / 39.7°N 78.1°W / 39.7; -78.1

 Upton Sheredine
 Gabriel Christie
 William Matthews
 Gabriel Christie
 John Archer
 John Montgomery
 Stevenson Archer
 Thomas Culbreth
 Jeremiah Cosden
 Philip Reed
 George E. Mitchell
 Levin Gale
 George E. Mitchell
 Charles S. Sewall
 William C. Johnson
 Francis Thomas
 John T. Mason, Jr.
 Thomas A. Spence
 Edward H. C. Long
 John W. Crisfield
 John B. Kerr
 Joseph S. Cottman
 Augustus R. Sollers
 Thomas F. Bowie
 George W. Hughes
 Charles B. Calvert
 Lloyd Lowndes, Jr.
 William Walsh
 Milton G. Urner
 Louis E. McComas
 William M. McKaig
 George Louis Wellington
 John McDonald
 George A. Pearre
 David J. Lewis
 Frederick N. Zihlman
 David J. Lewis
 William D. Byron
 Katharine Byron
 James G. Beall
 DeWitt S. Hyde
 John R. Foley
 Charles M. Mathias, Jr.
 John G. Beall, Jr.
 Goodloe E. Byron
 Beverly Butcher Byron
 Roscoe G. Bartlett
 John K. Delaney
