Livada, Satu Mare
Livada
Sárköz | |
|---|---|
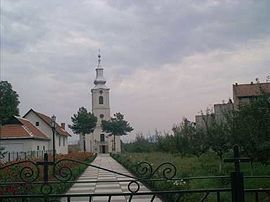
 Greek Catholic church in Livada | |
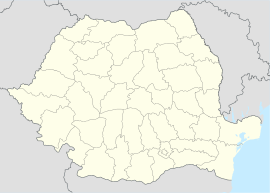
 Location in Satu Mare County | |
| Coordinates: 47°52′N 23°8′E / 47.867°N 23.133°E | |
| Country | Romania |
| County | Satu Mare |
| Government | |
| • Mayor (2020–2024) | Arthur Piricsi[1] (UDMR) |
| Area | 116.87 km2 (45.12 sq mi) |
| Elevation | 130 m (430 ft) |
| Population (2021-12-01)[2] | 5,892 |
| • Density | 50/km2 (130/sq mi) |
| Time zone | EET/EEST (UTC+2/+3) |
| Postal code | 447180 |
| Area code | (+40) 02 61 |
| Vehicle reg. | SM |
| Website | www |
Livada (formerly also Șarchiuz, from its Hungarian name of Sárköz, Hungarian pronunciation:[ˈʃaːrkøz]) Rusyn: Уйлак; German: Wiesenhaid) is a town in north-western Romania, in Satu Mare County. It received town status in 2006. The town administers three villages: Adrian (Hungarian: Adorján), Dumbrava (Hungarian: Meggyesgombás), and Livada Mică (Hungarian: Sárközújlak; Rusyn: Шаркиз).
Geography
[edit]The town is located in the northeastern part of the county, about 24 km (15 mi) from the county seat, Satu Mare, and belongs to the Satu Mare metropolitan area. Situated at an altitude of 130 m (430 ft), Livada lies on the banks of the river Racta and its right tributary, the Egher.
Demographics
[edit]| Year | Pop. | ±% |
|---|---|---|
| 1880 | 4,347 | — |
| 1890 | 4,129 | −5.0% |
| 1900 | 4,403 | +6.6% |
| 1910 | 4,690 | +6.5% |
| 1920 | 4,709 | +0.4% |
| 1930 | 5,348 | +13.6% |
| 1941 | 5,694 | +6.5% |
| 1956 | 6,340 | +11.3% |
| 1966 | 6,606 | +4.2% |
| 1977 | 7,382 | +11.7% |
| 1992 | 7,063 | −4.3% |
| 2002 | 7,004 | −0.8% |
| 2011 | 6,639 | −5.2% |
| 2021 | 5,892 | −11.3% |
| Source: Census data | ||
The national census of 2011 recorded a total population of 6,639, of whom 60.8% were of Hungarian ethnic origin, 35.5% of Romanian ethnic origin, and 3.2% Roma of ethnic origin.[3] The eligious affiliations were: 31% Orthodox, 26% Roman Catholic, 25% Greek Catholic, and 17% Reformed.[4]
At the 2021 census, Livada had a population of 5,892, of which 53.89% were Hungarians, 31.5% Romanians, and 4.55% Roma.[5]
See also
[edit]References
[edit]- ^ "Results of the 2020 local elections". Central Electoral Bureau. Retrieved 8 June 2021.
- ^ "Populaţia rezidentă după grupa de vârstă, pe județe și municipii, orașe, comune, la 1 decembrie 2021" (XLS). National Institute of Statistics.
- ^ "Archived copy" (PDF). Archived from the original (PDF) on 2013-10-29. Retrieved 2012-06-10.
{{cite web}}: CS1 maint: archived copy as title (link) - ^ Romanian Government Department of Interethnic Relations (in Romanian) Archived 2011-07-17 at the Wayback Machine
- ^ "Populația rezidentă după grupa de vârstă, pe județe și municipii, orașe, comune, la 1 decembrie 2021" (in Romanian). INSSE. 31 May 2023.


