User:Emk163/sandbox
Appearance
| |||||||||||||||||||||||||||||
538 members of the Electoral College 270 electoral votes needed to win | |||||||||||||||||||||||||||||
|---|---|---|---|---|---|---|---|---|---|---|---|---|---|---|---|---|---|---|---|---|---|---|---|---|---|---|---|---|---|
| Opinion polls | |||||||||||||||||||||||||||||
| Turnout | 66.2% (estimated)[1] | ||||||||||||||||||||||||||||
| |||||||||||||||||||||||||||||
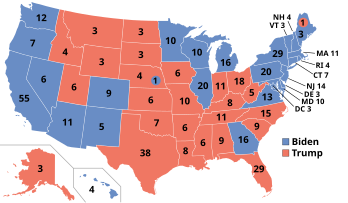
 Presidential election results map. Blue denotes states won by Biden/Harris, and red denotes those won by Trump/Pence. Numbers indicate electoral votes cast by each state and the District of Columbia. | |||||||||||||||||||||||||||||
| |||||||||||||||||||||||||||||
Cite error: There are <ref group=lower-alpha> tags or {{efn}} templates on this page, but the references will not show without a {{reflist|group=lower-alpha}} template or {{notelist}} template (see the help page).
- ^ 2020 November General Election Turnout Rates, United States Election Project. This turnout figure is the estimated number of ballots counted (including ballots without a valid vote for president) divided by the estimated number of eligible voters (U.S. residents, excluding those ineligible to vote due to lack of U.S. citizenship or to a criminal conviction, and U.S. citizens residing in other countries, at or over age 18). This figure is preliminary and unofficial, and not comparable to figures for previous years calculated by the Federal Election Commission, which uses only valid votes for president divided by the U.S. population at or over age 18 (including those ineligible to vote, and not including U.S. citizens residing in other countries).
- ^ a b Cite error: The named reference
FECwas invoked but never defined (see the help page). - ^ Choi, Matthew (October 31, 2019). "Trump, a symbol of New York, is officially a Floridian now". Politico. Retrieved October 31, 2019.


