
Villa Park, California
Villa Park, California | |
|---|---|
 Seal | |
| Motto: The Hidden Jewel of Orange County[1] | |
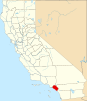
 Location within California and Orange County | |
| Coordinates: 33°48′58″N 117°48′40″W / 33.81611°N 117.81111°W | |
| Country | |
| State | |
| County | Orange |
| Incorporated | January 11, 1962[2] |
| Government | |
| • Type | Council–manager[1] |
| • Mayor | Vince Rossini[3] |
| Area | |
| • Total | 2.08 sq mi (5.38 km2) |
| • Land | 2.08 sq mi (5.38 km2) |
| • Water | 0.00 sq mi (0.00 km2) 0% |
| Elevation | 341 ft (104 m) |
| Population | |
| • Total | 5,812 |
| • Estimate (2018)[7] | 5,839 |
| • Density | 2,834.13/sq mi (1,095.72/km2) |
| Time zone | UTC-8 (Pacific) |
| • Summer (DST) | UTC-7 (PDT) |
| ZIP code | 92861 |
| Area codes | 657/714 |
| FIPS code | 06-82744 |
| GNIS feature IDs | 1661640, 2412158 |
| Website | www |
Villa Park is a city in Orange County, California, United States. It was incorporated in 1962. As of the 2010 Census, the city had a population of 5,812, the lowest population for a city in Orange County.
The city is largely zoned for single-family residences on lots that average about 20,000 square feet (1,900 m2), or 1/2 acre, in size. Within the city limits there is one small shopping center. City Hall, including a community room, and a branch of the Orange County Public Libraries system is adjacent to the city's only shopping center.
History
After the 1769 expedition of Gaspar de Portolà, a Spanish expedition led by Father Junipero Serra named the area Vallejo de Santa Ana (Valley of Saint Anne). On November 1, 1776, Mission San Juan Capistrano became the areas first permanent European settlement in Alta California, New Spain. In 1810, the Spanish Empire granted 62,500 acres (253 km2) to Jose Antonio Yorba, which he named Rancho Santiago de Santa Ana. Yorba's rancho included the lands where the cities of Olive, Orange, Villa Park, Santa Ana, Tustin, Costa Mesa and Newport Beach stand today.
After the Mexican-American war in 1848, Alta California became part of the United States in 1850 and American settlers arrived in this area.
Villa Park was known as "Mountain View" in the 1860s.[citation needed] The U.S. Post Office refused to allow the local post office to be so named as there was already a post office with that name in Mountain View), so the post office and hence the area came to be called Villa Park. It was then an agricultural area producing, in turn, grapes, walnuts, and apricots. Finally, citrus became the major crop for about 60 years.
Ranchers established the Serrano Water District, which still provides Villa Park's water, and founded the Villa Park Orchards Association (still a business in Orange, although the packing house that was a local landmark was torn down in 1983).
Geography
Villa Park is located at 33°48′58″N 117°48′40″W / 33.81611°N 117.81111°W (33.816183, −117.811106).[8] According to the United States Census Bureau, the city has a total area of 2.1 square miles (5.4 km2), all land.
There are no public parks within city limits; many homes have pools and/or tennis courts. Unlike more urban areas of Orange County west of the city, Villa Park has winding streets with few sidewalks and limited street lights. Throughout are trees and flower beds in planted medians and parkways. Surrounded by the city of Orange, Villa Park has the appearance of an enclave: the city's early unwillingness to annex lands beyond Santiago Creek and those east of a power line easement between the city and Anaheim Hills.
Demographics
| Census | Pop. | Note | %± |
|---|---|---|---|
| 1970 | 2,723 | — | |
| 1980 | 7,137 | 162.1% | |
| 1990 | 6,299 | −11.7% | |
| 2000 | 5,999 | −4.8% | |
| 2010 | 5,812 | −3.1% | |
| 2018 (est.) | 5,839 | [7] | 0.5% |
| U.S. Decennial Census[9] | |||
2000
As of the census[10] of 2000, there were 5,999 people, 1,950 households, and 1,764 families residing in the city. The population density was 2,844.9 inhabitants per square mile (1,097.7/km²). There were 2,008 housing units at an average density of 952.2 per square mile (367.4/km²). The racial makeup of the city was 82.40% White, 0.80% African American, 0.43% Native American, 12.92% Asian, 0.03% Pacific Islander, 0.93% from other races, and 2.48% from two or more races. Hispanic or Latino of any race were 5.90% of the population.
There were 1,950 households out of which 34.4% had children under the age of 18 living with them, 82.1% were married couples living together, 6.1% had a female householder with no husband present, and 9.5% were non-families. 7.9% of all households were made up of individuals and 4.3% had someone living alone who was 65 years of age or older. The average household size was 3.07 and the average family size was 3.22.
In the city, the population was spread out with 24.7% under the age of 18, 6.5% from 18 to 24, 21.2% from 25 to 44, 32.9% from 45 to 64, and 14.8% who were 65 years of age or older. The median age was 44 years. For every 100 females, there were 101.2 males. For every 100 females age 18 and over, there were 98.6 males.
The median income for a household in the city was $116,203, and the median income for a family was $124,852. Males had a median income of $78,563 versus $46,667 for females.
2010
The 2010 United States Census[11] reported that Villa Park had a population of 5,812. The population density was 2,796.6 people per square mile (1,079.8/km²). The racial makeup of Villa Park was 4,550 (78.3%) White (71.9% Non-Hispanic White),[12] 42 (0.7%) African American, 34 (0.6%) Native American, 854 (14.7%) Asian, 1 (0.0%) Pacific Islander, 162 (2.8%) from other races, and 169 (2.9%) from two or more races. Hispanic or Latino of any race were 598 persons (10.3%).
The census reported that 5,767 people (99.2% of the population) lived in households, 40 (0.7%) lived in non-institutionalized group quarters, and 5 (0.1%) were institutionalized.
There were 1,976 households, out of which 625 (31.6%) had children under the age of 18 living in them, 1,525 (77.2%) were opposite-sex married couples living together, 123 (6.2%) had a female householder with no husband present, 80 (4.0%) had a male householder with no wife present. There were 36 (1.8%) unmarried opposite-sex partnerships, and 8 (0.4%) same-sex married couples or partnerships. 208 households (10.5%) were made up of individuals and 144 (7.3%) had someone living alone who was 65 years of age or older. The average household size was 2.92. There were 1,728 families (87.4% of all households); the average family size was 3.11.
The population was spread out with 1,164 people (20.0%) under the age of 18, 458 people (7.9%) aged 18 to 24, 845 people (14.5%) aged 25 to 44, 1,934 people (33.3%) aged 45 to 64, and 1,411 people (24.3%) who were 65 years of age or older. The median age was 49.6 years. For every 100 females, there were 97.4 males. For every 100 females age 18 and over, there were 93.8 males.
There were 2,016 housing units at an average density of 970.1 per square mile (374.5/km²), of which 1,886 (95.4%) were owner-occupied, and 90 (4.6%) were occupied by renters. The homeowner vacancy rate was 0.5%; the rental vacancy rate was 3.2%. 5,486 people (94.4% of the population) lived in owner-occupied housing units and 281 people (4.8%) lived in rental housing units.
Government
The city is governed by five council members each elected for four-year terms. The current (2017) representatives on the City Council include Mayor Bill Nelson, Mayor Pro-Tem Bob Collacott and Councilmembers Vince Rossini , Robbie Pitts and Diana Fascenelli.
Politics
66.0% of the city's 4,533 registered voters declared their affiliation with the Republican party. 17.3% are registered Democrats, and 14.3% were unaffiliated voters.[13]
In the United States House of Representatives, Villa Park is in California's 45th congressional district, represented by Republican Michelle Steel.[14]
In the California State Legislature, Villa Park is in the 37th Senate District, represented by Democrat Dave Min, and in the 68th Assembly District, represented by Democrat Avelino Valencia.[15]
On the Orange County Board of Supervisors, Villa Park is in the 3rd District, represented by Donald P. Wagner.
Villa Park is one of the most consistently Republican cities in Orange County and in California as a whole. Every GOP candidate for president since the city's incorporation in 1962 has received at least 60% of the vote in the city. From 1968-1988, the city gave the Republican candidate over 80% of the vote in each election, and in 2016, the city gave Donald Trump over 60% of the vote and a 30 point margin of victory despite the fact that he became the first Republican candidate to lose Orange County since Alf Landon in 1936.
Villa Park is also largely Republican in California’s gubernatorial elections. In 1978, even as Orange County supported Jerry Brown in his re-election bid, Villa Park gave his opponent Evelle Younger, 57% of the vote.[16] In the GOP landslide victories of 1966, 1986, 1994, and 2006, the Republican candidates exceeded 80% of the vote in Villa Park.
| Year | Democratic | Republican | Third Parties |
|---|---|---|---|
| 2016[17] | 30.23% 1,098 | 60.38% 2,193 | 9.39% 341 |
| 2012[18] | 24.71% 928 | 73.00% 2,742 | 2.40% 90 |
| 2008[19] | 27.08% 1,021 | 70.39% 2,653 | 2.52% 95 |
| 2004[20] | 22.11% 830 | 75.60% 2,838 | 2.29% 86 |
| 2000[21] | 22.15% 782 | 75.18% 2,654 | 2.66% 94 |
| 1996[22] | 19.98% 655 | 73.00% 2,393 | 7.02% 230 |
| 1992[23] | 17.75% 646 | 65.11% 2,370 | 17.14% 624 |
| 1988[24] | 15.25% 557 | 83.82% 3,062 | 0.93% 34 |
| 1984[25] | 12.33% 414 | 87.10% 2,924 | 0.57% 19 |
| 1980[26] | 9.95% 331 | 83.32% 2,773 | 6.73% 224 |
| 1976[27] | 18.52% 554 | 80.38% 2,405 | 1.10% 33 |
| 1972[28] | 13.46% 245 | 81.09% 1,476 | 5.44% 99 |
| 1968[29] | 13.85% 108 | 81.79% 638 | 4.36% 34 |
| 1964[30] | 23.86% 131 | 76.14% 418 |
| Year | Democratic | Republican | Third Parties |
|---|---|---|---|
| 2018[31] | 31.06% 1,072 | 68.94% 2,379 | |
| 2014[32] | 24.68% 619 | 75.32% 1,889 | |
| 2010[33] | 19.87% 658 | 77.05% 2,552 | 3.08% 102 |
| 2006[34] | 11.05% 323 | 83.20% 2,432 | 5.75% 95 |
| 2003[35] | 8.06% 248 | 90.77% 2,792 | 1.17% 36 |
| 2002[36] | 16.43% 357 | 79.02% 1,717 | 4.56% 99 |
| 1998[37] | 26.42% 750 | 71.82% 2,039 | 1.76% 50 |
| 1994[38] | 12.56% 428 | 84.47% 2,878 | 2.96% 101 |
| 1990[39] | 17.11% 519 | 79.16% 2,401 | 3.73% 113 |
| 1986[40] | 12.71% 379 | 86.22% 2,571 | 1.07% 32 |
| 1982[41] | 22.16% 681 | 76.73% 2,358 | 1.11% 34 |
| 1978[42] | 34.06% 947 | 57.41% 1,596 | 8.53% 237 |
| 1974[43] | 22.02% 457 | 76.24% 1,582 | 1.73% 36 |
| 1970[44] | 15.74% 164 | 83.11% 866 | 1.15% 12 |
| 1966[45] | 13.66% 81 | 86.34% 512 | |
| 1962[46] | 17.62% 71 | 80.40% 324 | 1.99% 8 |
NOTE: The totals listed for the 2003 governor's special election are the aggregate totals for all Republican candidates, all Democratic candidates, and all Independent candidates. Individually, Arnold Schwarzenegger received 2,391 votes, Cruz Bustamante received 234 votes, and Tom McClintock received 384 votes.
| Year | Democratic | Republican | Third Parties |
|---|---|---|---|
| 2018[47] | 54.11% 1,442 | 45.89% 1,223 | |
| 2016[48] | 54.29% 1,594 | 45.71% 1,342 | |
| 2012[49] | 26.97% 979 | 73.03% 2,651 | |
| 2010[50] | 18.65% 614 | 78.38% 2,581 | 2.98% 98 |
| 2006[51] | 26.41% 740 | 69.81% 1,956 | 3.78% 106 |
| 2004[52] | 24.75% 909 | 72.28% 2,654 | 2.97% 109 |
NOTE: In the 2016, and 2018 senate elections in California, both candidates on the ballot were Democrats. The bolded totals listed were those of the candidates that won Villa Park Kamala Harris in 2016, and Dianne Feinstein in 2018. The runners-up in Villa Park were shaded in blue as well, but wound up in the Republican column of this table.
Education

There are four public schools with the city that are operated by the Orange Unified School District (the city's largest employer).
- Serrano Elementary School
- Villa Park Elementary
- Cerro Villa Middle School
- Villa Park High School
Notable people
- Bert Blyleven, Major League Baseball player
- Aaron Boone, Major League Baseball Player
- Rosalind Chao, actress
- Aaron Corp, Richmond quarterback
- Kevin Costner, graduated from Villa Park High School in 1973.
- Leigh Donovan, Professional mountain bike racer. Class of 90
- Freddie Freeman, Atlanta Braves 1st base MLB Allstar
- Susan McCaw, former US Ambassador to Austria
- Pat McInally, former National Football League player (and only NFL player to score a perfect 50 on the Wonderlic Test)
- L.J. Smith, Author, The Vampire Diaries
- Mark Trumbo, Baltimore Orioles player, graduated from Villa Park High School in 2005.
- Del Worsham, Professional drag racer
- Jose Feliciano, Singer, Entertainer
- Nolan Ryan, California Angels Pitcher
References
- ^ a b "The City of Villa Park invites your interest in the position of City Manager" (PDF). Retrieved February 19, 2015.
- ^ "California Cities by Incorporation Date". California Association of Local Agency Formation Commissions. Archived from the original (Word) on November 3, 2014. Retrieved August 25, 2014.
- ^ "City Council". Cit of Villa Park, California. Retrieved December 17, 2014.
- ^ "2016 U.S. Gazetteer Files". United States Census Bureau. Retrieved June 28, 2017.
- ^ "Villa Park". Geographic Names Information System. United States Geological Survey, United States Department of the Interior. Retrieved February 19, 2015.
- ^ "Villa Park (city) QuickFacts". United States Census Bureau. Archived from the original on March 28, 2015. Retrieved March 30, 2015.
- ^ a b "Population and Housing Unit Estimates". Retrieved September 11, 2019.
- ^ "US Gazetteer files: 2010, 2000, and 1990". United States Census Bureau. February 12, 2011. Retrieved April 23, 2011.
- ^ "Census of Population and Housing". Census.gov. Archived from the original on April 26, 2015. Retrieved June 4, 2015.
- ^ "American FactFinder". United States Census Bureau. Archived from the original on September 11, 2013. Retrieved January 31, 2008.
- ^ "2010 Census Interactive Population Search: CA - Villa Park city". U.S. Census Bureau. Retrieved July 12, 2014.
- ^ "Archived copy". Archived from the original on March 28, 2015. Retrieved March 30, 2015.
{{cite web}}: CS1 maint: archived copy as title (link) - ^ "Archived copy" (PDF). Archived from the original (PDF) on July 1, 2014. Retrieved December 16, 2009.
{{cite web}}: CS1 maint: archived copy as title (link) - ^ "California's 45th Congressional District - Representatives & District Map". Civic Impulse, LLC.
- ^ "Statewide Database". UC Regents. Retrieved November 29, 2014.
- ^ https://archive.org/details/statementofvote197879cali/page/62
- ^ https://elections.cdn.sos.ca.gov/sov/2016-general/ssov/pres-by-political-districts.pdf
- ^ https://www.ocvote.com/fileadmin/live/gen2012/sov-for-web.pdf
- ^ https://www.ocvote.com/fileadmin/user_upload/sov/gen2008/sov.pdf
- ^ https://www.ocvote.com/fileadmin/user_upload/sov/e13/sov1.pdf
- ^ https://www.ocvote.com/fileadmin/user_upload/sov/gen2000/gen2000-SOV.pdf
- ^ https://elections.cdn.sos.ca.gov/sov/1996-general/ssov/president-pol-district.pdf
- ^ https://elections.cdn.sos.ca.gov/sov/1992-general/ssov/ssov-complete.pdf
- ^ Statement of the Vote. Sacramento, Calif. : The Secretary. 1968.
- ^ Statement of the Vote. Sacramento, Calif. : The Secretary. 1968.
- ^ Statement of the Vote. Sacramento, Calif. : The Secretary. 1968.
- ^ Statement of the Vote. Sacramento, Calif. : The Secretary. 1968.
- ^ "California Statement of Vote 1970-1972".
- ^ "California Statement of Vote 1966-1968".
- ^ "California Statement of Vote 1962-1964".
- ^ https://elections.cdn.sos.ca.gov/sov/2018-general/ssov/governor-pol-districts.pd
- ^ https://elections.cdn.sos.ca.gov/sov/2014-general/ssov/governor-pol-districts.pdf
- ^ https://elections.cdn.sos.ca.gov/sov/2010-general/ssov/governor-all.pdf
- ^ https://elections.cdn.sos.ca.gov/sov/2006-general/ssov/gov_by_all.pdf
- ^ https://archive.org/details/statementofvote72003cali
- ^ https://elections.cdn.sos.ca.gov/sov/2002-general/ssov/gov-pol-dis.pdf
- ^ https://archive.org/details/statementofvote31998cali/page/18
- ^ https://elections.cdn.sos.ca.gov/sov/1994-general/ssov/governor-pol-district.pdf
- ^ https://elections.cdn.sos.ca.gov/sov/1990-general/ssov/governor-pol-district.pdf
- ^ https://archive.org/details/statementofvote41986cali/page/28
- ^ https://archive.org/details/statementofvote21982cali/page/28
- ^ https://archive.org/details/statementofvote197879cali/page/62
- ^ https://archive.org/details/statementofvote197374cali
- ^ https://archive.org/details/statementofvote197072cali/page/n127
- ^ https://archive.org/details/californiastate196668cali/page/n121
- ^ https://archive.org/details/castatem196264cali/page/n97
- ^ https://elections.cdn.sos.ca.gov/sov/2018-general/ssov/us-senate-by-political-districts.pdf
- ^ https://elections.cdn.sos.ca.gov/sov/2016-general/ssov/us-senate-by-political-districts.pdf
- ^ https://elections.cdn.sos.ca.gov/sov/2012-general/ssov/us-senate-by-political-districts.pdf
- ^ https://elections.cdn.sos.ca.gov/sov/2010-general/ssov/us-senate-all.pdf
- ^ https://elections.cdn.sos.ca.gov/sov/2006-general/ssov/us_sen_by_all.pdf
- ^ https://elections.cdn.sos.ca.gov/sov/2004-general/ssov/us_senate_ssov_all.pdf
External links
| International | |
|---|---|
| National | |
| Geographic | |