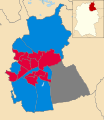
Swindon Borough Council elections
Appearance
Swindon Borough Council is the local authority for the unitary authority of Swindon in Wiltshire, England. Until 1 April 1997 its area was a non-metropolitan district called Thamesdown Borough Council, with Wiltshire County Council providing the county-level services. Also in April 1997, less than a month after taking over the county-level services, the council changed its name from Thamesdown to Swindon.
Political control
Since the first election to the new Thamesdown borough council in 1973, political control of the council has been held by the following parties:[1][2]
Thamesdown (district council)
| Party in control | Years | |
|---|---|---|
| Labour | 1973–1976 | |
| No overall control | 1976–1978 | |
| Labour | 1978–1997 | |
Swindon Borough Council (unitary authority)
| Party in control | Years | |
|---|---|---|
| Labour | 1997–2000 | |
| No overall control | 2000–2004 | |
| Conservative | 2004–present | |
Leadership
The role of mayor is largely ceremonial in Swindon, with political leadership instead being provided by the leader of the council. The leaders since 1998 have been:[3]
| Councillor | Party | From | To | |
|---|---|---|---|---|
| Sue Bates | Labour | 1998 | ||
| Maurice Fanning | Labour | 1998 | 1999 | |
| Sue Bates | Labour | 1999 | 27 Sep 2001 | |
| Mike Bawden | Conservative | 11 Oct 2001 | 17 May 2002 | |
| Sue Bates | Labour | 17 May 2002 | 21 Aug 2002 | |
| Kevin Small | Labour | 21 Aug 2002 | 16 May 2003 | |
| Mike Bawden | Conservative | 16 May 2003 | 19 May 2006 | |
| Roderick Bluh | Conservative | 19 May 2006 | 11 Apr 2013 | |
| David Renard | Conservative | 11 Apr 2013 | ||
Council elections
District council
- 1973 Thamesdown Borough Council election
- 1976 Thamesdown Borough Council election (New ward boundaries)[4]
- 1978 Thamesdown Borough Council election
- 1979 Thamesdown Borough Council election
- 1980 Thamesdown Borough Council election
- 1982 Thamesdown Borough Council election (Some new ward boundaries & borough boundary changes)[5][6]
- 1983 Thamesdown Borough Council election
- 1984 Thamesdown Borough Council election
- 1986 Thamesdown Borough Council election (New ward boundaries)[7]
- 1987 Thamesdown Borough Council election
- 1988 Thamesdown Borough Council election
- 1990 Thamesdown Borough Council election
- 1991 Thamesdown Borough Council election
- 1992 Thamesdown Borough Council election
- 1994 Thamesdown Borough Council election
- 1995 Thamesdown Borough Council election
- 1996 Thamesdown Borough Council election
Unitary authority
- 1998 Swindon Borough Council election
- 1999 Swindon Borough Council election
- 2000 Swindon Borough Council election (New ward boundaries increased the number of seats by 5)[8][9][10]
- 2002 Swindon Borough Council election
- 2003 Swindon Borough Council election
- 2004 Swindon Borough Council election
- 2006 Swindon Borough Council election
- 2007 Swindon Borough Council election
- 2008 Swindon Borough Council election
- 2010 Swindon Borough Council election
- 2011 Swindon Borough Council election
- 2012 Swindon Borough Council election (New ward boundaries)[11]
- 2014 Swindon Borough Council election
- 2015 Swindon Borough Council election (New ward boundaries)[12]
- 2016 Swindon Borough Council election
- 2018 Swindon Borough Council election[13]
- 2019 Swindon Borough Council election
- 2021 Swindon Borough Council election
- 2022 Swindon Borough Council election
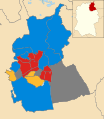
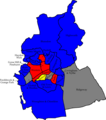
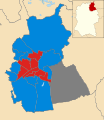
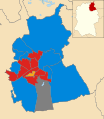
Results maps
-
2000 results map
-
2002 results map
-
2003 results map
-
2004 results map
-
2006 results map
-
2007 results map
-
2008 results map
-
2010 results map
-
2011 results map
-
2012 results map
-
2014 results map
-
2015 results map
-
2016 results map
-
2018 results map
-
2019 results map
-
2021 results map
-
2022 results map
By-election results
1997–2001
| Party | Candidate | Votes | % | ±% | |
|---|---|---|---|---|---|
| Labour | 548 | 46.3 | |||
| Liberal Democrats | 300 | 25.3 | |||
| Conservative | 224 | 18.9 | |||
| Green | 69 | 5.8 | |||
| Socialist Labour | 44 | 53.7.8 | |||
| Majority | 248 | 21.0 | |||
| Turnout | 1,185 | 20.7 | |||
| Labour hold | Swing | ||||
| Party | Candidate | Votes | % | ±% | |
|---|---|---|---|---|---|
| Labour | 715 | 66.0 | −4.4 | ||
| Conservative | 297 | 27.4 | +11.2 | ||
| Liberal Democrats | 72 | 6.6 | −6.8 | ||
| Majority | 418 | 38.6 | |||
| Turnout | 1,084 | 15.2 | |||
| Labour hold | Swing | ||||
2001–2005
| Party | Candidate | Votes | % | ±% | |
|---|---|---|---|---|---|
| Conservative | Raymond Fisher | 814 | 52.5 | +5.3 | |
| Labour | 409 | 26.4 | −13.2 | ||
| Liberal Democrats | 258 | 16.6 | +3.4 | ||
| UKIP | 69 | 4.5 | +4.5 | ||
| Majority | 405 | 26.1 | |||
| Turnout | 1,550 | 20.6 | |||
| Conservative gain from Labour | Swing | ||||
| Party | Candidate | Votes | % | ±% | |
|---|---|---|---|---|---|
| Labour | 513 | 37.9 | +0.3 | ||
| Liberal Democrats | 359 | 26.5 | −12.1 | ||
| Conservative | 229 | 16.9 | −0.6 | ||
| SA | 119 | 8.8 | +8.8 | ||
| Green | 71 | 5.2 | +5.2 | ||
| SOU | 41 | 3.0 | −3.2 | ||
| UKIP | 21 | 1.6 | +1.6 | ||
| Majority | 154 | 11.4 | |||
| Turnout | 1,353 | 19.4 | |||
| Labour hold | Swing | ||||
| Party | Candidate | Votes | % | ±% | |
|---|---|---|---|---|---|
| Labour | 829 | 47.5 | +4.2 | ||
| Conservative | 651 | 37.3 | +11.3 | ||
| Liberal Democrats | 154 | 8.8 | −13.5 | ||
| UKIP | 79 | 4.5 | −3.9 | ||
| Green | 34 | 1.9 | +1.9 | ||
| Majority | 178 | 10.2 | |||
| Turnout | 1,747 | 23.5 | |||
| Labour hold | Swing | ||||
| Party | Candidate | Votes | % | ±% | |
|---|---|---|---|---|---|
| Labour | Peter Mallinson | 706 | 38.4 | −3.4 | |
| Conservative | 586 | 31.9 | −1.8 | ||
| Liberal Democrats | 338 | 18.4 | +1.2 | ||
| Independent | 106 | 5.8 | +5.8 | ||
| Green | 60 | 3.3 | −3.9 | ||
| UKIP | 43 | 2.3 | +2.3 | ||
| Majority | 120 | 6.5 | |||
| Turnout | 1,839 | 35.0 | |||
| Labour gain from Conservative | Swing | ||||
2009–2013
| Party | Candidate | Votes | % | ±% | |
|---|---|---|---|---|---|
| Labour | Jenny Millin | 887 | 47.5 | +12.6 | |
| Conservative | Toby Elliott | 755 | 40.4 | +1.0 | |
| UKIP | William Oram | 129 | 6.9 | +6.9 | |
| Liberal Democrats | Chris Ward | 98 | 5.2 | −13.3 | |
| Majority | 132 | 7.1 | |||
| Turnout | 1,869 | 23.7 | |||
| Labour gain from Conservative | Swing | ||||
| Party | Candidate | Votes | % | ±% | |
|---|---|---|---|---|---|
| Conservative | Steve Weisinger | 1,453 | |||
| Labour | Phil Beaumont | 1,075 | |||
| UKIP | John Lenton | 195 | |||
| Green | Andrew Donald Day | 111 | |||
| Liberal Democrats | Cath Smith | 23 | |||
| Majority | 378 | ||||
| Turnout | 32.6 | ||||
| Conservative hold | Swing | ||||
References
- ^ "Council compositions". The Elections Centre. Retrieved 3 May 2016.
- ^ "Swindon". BBC News Online. 19 April 2008. Retrieved 18 March 2010.
- ^ "Council minutes". Swindon Borough Council. Retrieved 29 June 2022.
- ^ legislation.gov.uk – The Borough of Thamesdown (Electoral Arrangements) Order 1975. Retrieved on 19 November 2015.
- ^ legislation.gov.uk – The North Wiltshire and Thamesdown (Areas) Order 1980. Retrieved on 18 November 2015.
- ^ The Oxfordshire and Wiltshire (Areas) Order 1980
- ^ The Borough of Thamesdown (Electoral Arrangements) Order 1986
- ^ legislation.gov.uk – The Borough of Swindon (Electoral Changes) Order 1999. Retrieved on 4 October 2015.
- ^ "Swindon". BBC News Online. Retrieved 16 August 2009.
- ^ "Want to be a Councillor?". Swindon Borough Council. Retrieved 18 March 2010.
- ^ legislation.gov.uk – The Swindon (Electoral Changes) Order 2012. Retrieved on 3 November 2015.
- ^ legislation.gov.uk – The Swindon (Electoral Changes) Order 2015. Retrieved on 3 November 2015.
- ^ "Local Elections 2018 – Swindon Borough Council". BBC News. 2018. Retrieved 6 May 2018.
- ^ "Labour slips in the snow". guardian.co.uk. London. 31 January 2003. Retrieved 18 March 2010.
- ^ "Double defeat for Tories in the west of England". guardian.co.uk. London. 4 February 2005. Retrieved 18 March 2010.
- ^ "Labour takes seat from Tories in election". This is Wiltshire.co.uk. 5 November 2010. Retrieved 6 November 2010.
- ^ "Conservatives hold Blunsdon and Highworth ward in by election". swindonadvertiser.co.uk. 16 November 2012. Retrieved 16 November 2012.


