Bar chart: Difference between revisions
Appearance
Content deleted Content added
No edit summary |
Tag: repeating characters |
||
| Line 8: | Line 8: | ||
==See also== |
==See also== |
||
* [[Histogram]] |
* [[Histogram]] |
||
* [[ |
* [[Ganfffffffftt chart]] |
||
* [[Open-high-low-close chart]] |
* [[Open-high-low-close chart]] |
||
* [[Candlestick chart]] |
* [[Candlestick chart]] |
||
Revision as of 00:30, 14 July 2011

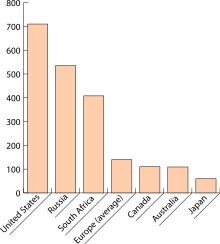
A bar chart or bar graph is a chart with rectangular bars with lengths proportional to the values that they represent. The bars can be plotted vertically or horizontally.
Bar charts are used for plotting discrete (or 'discontinuous') data which has discrete values and is not continuous. Some examples of discontinuous data include 'shoe size' or 'eye colour', for which you would use a bar chart. In contrast, some examples of continuous data would be 'height' or 'weight'. A bar chart is very useful if you are trying to record certain information whether it is continuous or not continuous data. Bar charts also look a lot like a histogram.They are often mistaken for each other.
See also
- Histogram
- Ganfffffffftt chart
- Open-high-low-close chart
- Candlestick chart
- Pie chart
- List of information graphics software#Plotting programs (graphing programs)
- Commons:Chart and graph resources
- commons:Bar chart - many free bar chart examples organized by type.compares data easy.
External links
Wikimedia Commons has media related to Bar charts.
- EIA Guidelines for Statistical Graphs
- How to Construct Bad Charts and Graphs
- Directory of graph software and online tools (many can handle bar charts)
- Create A Graph. Free online graph creation tool at the website for the National Center for Education Statistics (NCES)
