
Talk:2009 swine flu pandemic by country
| This is the talk page for discussing improvements to the 2009 swine flu pandemic by country article. This is not a forum for general discussion of the article's subject. |
Article policies
|
| Find medical sources: Source guidelines · PubMed · Cochrane · DOAJ · Gale · OpenMD · ScienceDirect · Springer · Trip · Wiley · TWL |
| Archives: 1, 2 |
| A summary of this article appears in 2009 swine flu outbreak. |
| This article is of interest to multiple WikiProjects. | ||||||||||||||||||||||||||||||||||||||||||||||||||||||||||||||||||||||||||||||||||||||||||||
| ||||||||||||||||||||||||||||||||||||||||||||||||||||||||||||||||||||||||||||||||||||||||||||


| If this page has been recently modified, it may not reflect the most recent changes. Please purge this page to view the most recent changes. |
Error: Target page was not specified with to. |
Error: Target page was not specified with to. |
Error: Target page was not specified with to. |
|
This page has archives. Sections may be automatically archived by Lowercase sigmabot III. |
Transmission Rates Chart Disappeared
Please put that section back in the chart. It was VERY helpful. —Preceding unsigned comment added by 222.127.216.166 (talk) 07:58, 22 May 2009 (UTC)
Number of suspected cases that are NEGATIVE
The one thing I see missing from the table that would give a ratio indication of the transmission rate of the virus now, is a column to report on the number of suspected cases that are reported to be NEGATIVE. The table over time, depicts the change in status to the number of cases that are postive.
Further, the number of suspected cases that are reported fluctuates a lot more than the confirmed cases. Right now that only shows one side of the story as suspected cases may be removed because it some are erroneous, not becuase it was confirmed negative. So perhaps report the erroneous number as well, if not here on another page. It is vital to understand how many suspected and investigated cases are reporting NEGATIVE. This may obviously be very hard to do as bad news is discovered and spread more than news that does not shock, but reduces the expectation of the event. Prehaps Google Flu Trends can help.
This page is BRILLIANT, it is a fairly accrurate (as fairly can be) and vital number representation of the past week, this can not be found anywhere else. The version history will be (painful) but valuable for someone if the wanted to try to estimated the doubling time of the suspects and confirmed case. That is an important figure. For people and not only Google, to be trending the future, we need to think of the value that this massive community of people can make in realtime, to assiting us to get an informed overview of the current state and future evolution. To ALL technical people out there humanity has a virus and we have no patch, it has spread to multiple subnets and it is spreading within these subnets, it has spread from a subnet to another. AND we are NOT shutting down the gateways. If it does not stop naturely than we have a pandemic already. The network has a virus.
What is the infection ratio, what is the transmission rate, these are not the most important things. These numbers will represent the change, either way, decrease or increase. Someone that knows wikipedia better than I would know if that was possible to do or not.
Thanks
Veracruz?

Where's Turkey?
Well, I miss further information about the turkish cases in the list... Liberty Valence (talk) 11:58, 17 May 2009 (UTC)
Turkey is STILL missing! Could PLEASE someone edit? Liberty Valence (talk) 09:37, 20 May 2009 (UTC)
Japan map File:H1N1_Japan_Map.svg
-
 H1N1_Japan_Map.svg
 -
 H1N1_Japan_Map_ja.svg


The Japan map File:H1N1_Japan_Map.svg (the second version) is incorrect, and this map should be removed. No domestic infection case has been confirmed in Tokyo. This map is now questioned also at Japanese Wikipedia, mainly because Tokyo is categorized mistakenly. Drawing area-grouping maps for certain countries (like this one) may be a good idea, but such a map should not be used at least until it becomes well-verifiable. What is the source for Tokyo? The problem as to this map is not where Narita Airport is located (exactly not in Tokyo, though). I think port-quarantined (i.e. non-domestic) cases are to be excluded from such an area-grouping map. If included, wrong information can be read from the map as if an outbreak had been confirmed in a certain area, only because an international airport is located there. --Dumpty-Humpty (talk) 02:58, 19 May 2009 (UTC)
- Couldn't someone from the Japanese Wikipedia have updated it to correct for errors? (ie. What Wikipedia Is) 76.66.202.139 (talk) 03:42, 19 May 2009 (UTC)
- I see no reason to exclude quarantined cases, since other countries include these cases in their maps. And non-Domestic cases are also included in those maps, so why should Japan be special? The first death in the US was non-domestic, yet the US got colored black. The cases in Hong Kong began as non-domestic, yet it was colored red. 76.66.202.139 (talk) 03:48, 19 May 2009 (UTC)
- Exactly, i did the map, and it was in fact at Narita Airpot, if you see an error you can update it by yourself and stop complaining for no reasons. --Vrysxy
 ¡Californication! 05:57, 19 May 2009 (UTC)
- Hi. Please note that Narita International Airport (a.k.a. New Tokyo International Airport) is located in Chiba prefecture, NOT in Tokyo metropolitan prefecture. Actually no infected patients found in Tokyo for now. I don't know if or not sates (or prefectures) just having quarantine station at international airport where infection case confirmed are colored red in those for other countries such as the United Sates, but at least the current image having Tokyo in red is obviously wrong. And unfortunately, I don't have a good paint tool to fix it. --Penn Station (talk) 06:24, 19 May 2009 (UTC)
- I wish I could fix it, but my paint tool seems not good for the job. Please be sure not to overlook the difference between coloring by governments (as examples shown by 76.66.202.139) and categorizing local districts in one country like Japan with a non-federal government. As a result of nation-run quarantine, Japan became a country whose government confirmed infection cases, and Japan in a world map can be colored as so; but it's of no use coloring a district in Japan because of the quarantined cases: they were not detected by Narita City, and they do not mean that a person in Narita City was confirmed infected. On the other hand, the cases of Kobe City, for example, are the cases of persons in the city, and were detected by the city and were confirmed by the government of Japan as domestic cases. I see no reason to mix up quarantined cases with domestic ones in categorizing municipalities in Japan. --Dumpty-Humpty (talk) 06:59, 19 May 2009 (UTC)
- Hi. Please note that Narita International Airport (a.k.a. New Tokyo International Airport) is located in Chiba prefecture, NOT in Tokyo metropolitan prefecture. Actually no infected patients found in Tokyo for now. I don't know if or not sates (or prefectures) just having quarantine station at international airport where infection case confirmed are colored red in those for other countries such as the United Sates, but at least the current image having Tokyo in red is obviously wrong. And unfortunately, I don't have a good paint tool to fix it. --Penn Station (talk) 06:24, 19 May 2009 (UTC)
- So sorry for the hasty and aggressive comments by a troubled person in ja. I updated the correct version of the image. Japanese ministry, however, is now treating port-quarantined cases, which are not spreading in town, and domestic cases differently; it is "Japan-POV", in other word. Although both cases may treat as same later, we Japanese now need the alternative image. So I uploaded both images from worldwide- and Japan-POV. Thanks. --Y tambe (talk) 07:05, 19 May 2009 (UTC)
- Well, I admit my speech here was not always well-refined because I hoped another opinion would come soon on this point. I don't know if it's a global trend to treat quarantined cases and domestic ones equally, but I also think it may be a Japanese point of view to treat the two differently, as Y tambe stated. Thanks all for your opinions. --Dumpty-Humpty (talk) 09:20, 19 May 2009 (UTC)
- Exactly, i did the map, and it was in fact at Narita Airpot, if you see an error you can update it by yourself and stop complaining for no reasons. --Vrysxy
- The map has been fixed and the one that i will be updating will be the first one.--Californication! (talk) 14:10, 19 May 2009 (UTC)
- That's good enough. I will update the other one for a while, maybe until either Japanese ministry would change their policy or, unfortunately, the flu would spread to Chiba pref. FYI, one patient was confirmed in Shiga Prefecture.[1] And I ask you to consider the color of Awaji Island to be changed in your next update. It is a part of Hyogo, though there are no patient confirmed in the island (so the color would not be changed in ja version). Use your judgement, please. Thanks. --Y tambe (talk) 02:52, 20 May 2009 (UTC)
- On 22 May I've got a tool to handle SVG file; just now I colored Kyoto Prefecture as it got confirmed cases (source), and Awaji Island because Hyogo Prefecture did. Shiga had already been colored as so. (Awaji Island is not treated separately, according to the Japanese text description saying this map shows categorization of prefectures.) -- With regards, Dumpty-Humpty (talk) 02:17, 22 May 2009 (UTC)
- P.S. Awaji coloring was undone; I modified Japanese description so that an island can be treated separately.
- I will copy this section into commons:File talk:H1N1 Japan Map.svg. Thanks. --Dumpty-Humpty (talk) 05:17, 22 May 2009 (UTC)
- That's good enough. I will update the other one for a while, maybe until either Japanese ministry would change their policy or, unfortunately, the flu would spread to Chiba pref. FYI, one patient was confirmed in Shiga Prefecture.[1] And I ask you to consider the color of Awaji Island to be changed in your next update. It is a part of Hyogo, though there are no patient confirmed in the island (so the color would not be changed in ja version). Use your judgement, please. Thanks. --Y tambe (talk) 02:52, 20 May 2009 (UTC)
Europe
-
 H1N1 Europe Map.svg
 -
Swine flu Europe Map.png

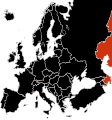
Someone seems to have removed the Europe map... File:H1N1 Europe Map.svg
76.66.202.139 (talk) 05:46, 20 May 2009 (UTC)
- Someone added a different map instead of updating the old one... File:Swine flu Europe Map.png. This now breaks the images across multiple languages, since they use the other image. 76.66.196.85 (talk) 04:52, 23 May 2009 (UTC)
Ecuador
-
H1N1 Ecuador Map.PNG
-
H1N1 Ecuador Map.svg
There are two versions of the map... 76.66.202.139 (talk) 04:03, 21 May 2009 (UTC)
Peru
The Peruvian map is incorrect, the virus have been confirmed in Lima Province, which is the metropolitan area of Lima, the map currently have in red the Lima Region where no cases are confirmed or suspected. Also one of the confirmed cases is in the Arequipa Region. 201.230.37.233 (talk) 06:17, 21 May 2009 (UTC)
Philippines

There's a Philippines map available... File:Ph swineflumap.png
76.66.196.85 (talk) 13:25, 22 May 2009 (UTC)
Charts
-WHO.PNG)
-WHO-log.PNG)
Found on the Japanese Wikipedia. 76.66.196.85 (talk) 13:37, 22 May 2009 (UTC)
- B-Class medicine articles
- Low-importance medicine articles
- All WikiProject Medicine articles
- B-Class virus articles
- Low-importance virus articles
- WikiProject Viruses articles
- B-Class Disaster management articles
- Low-importance Disaster management articles
- B-Class International relations articles
- Low-importance International relations articles
- WikiProject International relations articles
- B-Class Canada-related articles
- Low-importance Canada-related articles
- All WikiProject Canada pages
- B-Class Mexico articles
- Low-importance Mexico articles
- WikiProject Mexico articles
- B-Class United States articles
- Low-importance United States articles
- B-Class United States articles of Low-importance
- WikiProject United States articles