Mixdorf

Coordinates: 52°12′N 14°24′E / 52.200°N 14.400°E / 52.200; 14.400
From Wikipedia, the free encyclopedia

This is an old revision of this page, as edited by Kelutral (talk | contribs) at 13:51, 21 August 2018. The present address (URL) is a permanent link to this revision, which may differ significantly from the current revision.

Mixdorf
Coat of arms of Mixdorf
Location of Mixdorf within Oder-Spree district
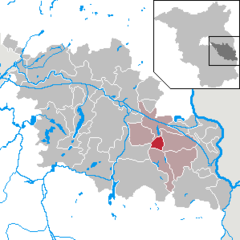
Bad SaarowBeeskowBerkenbrückBriesenBrieskow-FinkenheerdDiensdorf-RadlowEisenhüttenstadtErknerFriedlandFürstenwaldeGosen-Neu ZittauGroß LindowGrünheideGrunow-DammendorfJacobsdorfLangewahlLawitzBriesen (Mark)MixdorfMüllroseNeißemündeNeuzelleRagow-MerzRauenReichenwaldeRietz-NeuendorfSchlaubetalSchöneicheSiehdichumSpreenhagenSteinhöfelStorkowTaucheVogelsangWendisch RietzWiesenauWoltersdorfZiltendorfBrandenburg
Mixdorf is located in Germany
Mixdorf
Mixdorf
Mixdorf is located in Brandenburg
Mixdorf
Mixdorf
Coordinates: 52°12′N 14°24′E / 52.200°N 14.400°E / 52.200; 14.400
CountryGermany
StateBrandenburg
DistrictOder-Spree
Municipal assoc.Schlaubetal
Government
 • MayorKarl-Friedrich Rubach (SPD)
Area
 • Total13.03 km2 (5.03 sq mi)
Elevation
61 m (200 ft)
Population
 (2022-12-31)[1]
 • Total924
 • Density71/km2 (180/sq mi)
Time zoneUTC+01:00 (CET)
 • Summer (DST)UTC+02:00 (CEST)
Postal codes
15299
Dialling codes033655
Vehicle registrationLOS

Mixdorf is a municipality in the Oder-Spree district, in Brandenburg, Germany.
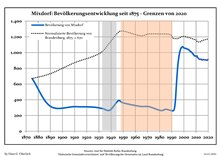
Demography

Development of Population since 1875 within the Current Boundaries (Blue Line: Population; Dotted Line: Comparison to Population Development of Brandenburg state; Grey Background: Time of Nazi rule; Red Background: Time of Communist rule)
Mixdorf: Population development
within the current boundaries (2013)[2]
YearPop.±% p.a.
1875 670—    
1890 317−4.87%
1910 312−0.08%
1925 307−0.11%
1933 288−0.80%
1939 268−1.19%
1946 388+5.43%
1950 360−1.86%
1964 316−0.93%
1971 313−0.14%
1981 263−1.73%
1985 279+1.49%
1989 265−1.28%
1990 262−1.13%
1991 259−1.15%
1992 277+6.95%
1993 389+40.43%
1994 634+62.98%
1995 838+32.18%
1996 958+14.32%
YearPop.±% p.a.
1997 1,032+7.72%
1998 1,063+3.00%
1999 1,074+1.03%
2000 1,060−1.30%
2001 1,055−0.47%
2002 1,051−0.38%
2003 1,043−0.76%
2004 1,037−0.58%
2005 1,020−1.64%
2006 1,009−1.08%
2007 993−1.59%
2008 972−2.11%
2009 958−1.44%
2010 955−0.31%
2011 940−1.57%
2012 927−1.38%
2013 914−1.40%
2014 917+0.33%
2015 906−1.20%
2016 912+0.66%

References

  1. ^ "Bevölkerungsentwicklung und Bevölkerungsstandim Land Brandenburg Dezember 2022" (PDF). Amt für Statistik Berlin-Brandenburg (in German). June 2023.
  2. ^ Detailed data sources are to be found in the Wikimedia Commons.Population Projection Brandenburg at Wikimedia Commons