
1994 London local elections
| |||||||||||||||||||||||||||||||||||||||||||||
All 1,917 on all 32 London boroughs | |||||||||||||||||||||||||||||||||||||||||||||
|---|---|---|---|---|---|---|---|---|---|---|---|---|---|---|---|---|---|---|---|---|---|---|---|---|---|---|---|---|---|---|---|---|---|---|---|---|---|---|---|---|---|---|---|---|---|
| Turnout | 46.1% ( | ||||||||||||||||||||||||||||||||||||||||||||
| |||||||||||||||||||||||||||||||||||||||||||||
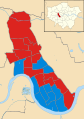
 Results by Borough in 1994. | |||||||||||||||||||||||||||||||||||||||||||||


Local government elections took place in London, and some other parts of the United Kingdom on Thursday 5 May 1994. Ward changes took place in Barking and Dagenham and Ealing which increased the total number of councillors by 3 from 1,914 to 1,917.
All London borough council seats were up for election. The previous Borough elections in London were in 1990.[1]
The Labour Party under John Smith achieved its best result since 1974, gaining 119 councillors and control of 3 councils. The Conservatives saw heavy losses, losing 212 councillors and 8 councils; the Conservative collapse also benefited the Liberal Democrats, who recovered from their 1990 low point and gained 94 councillors.
Results summary
style="width: 2px; background-color: #0087DC;" data-sort-value="Conservative Party (UK)" | style="width: 2px; background-color: #FAA61A;" data-sort-value="Liberal Democrats (UK)" | style="width: 2px; background-color: #02A95B;" data-sort-value="Green Party of England and Wales" | style="width: 2px; background-color: black;" data-sort-value="No overall control" || Party[2] | Votes won | % votes | Change | Seats | % seats | Change | Councils | Change | |
|---|---|---|---|---|---|---|---|---|---|
| Labour | 927,157 | 41.6 | +2.7 | 1,044 | 54.5 | +118 | 17 | +3 | |
| Conservative | 696,087 | 31.2 | -6.6 | 519 | 27.1 | -211 | 4 | -8 | |
| Liberal Democrats | 490,259 | 22.0 | +7.8 | 323 | 16.8 | +96 | 3 | ±0 | |
| Green | 48,798 | 2.2 | -3.7 | 0 | 0.0 | ±0 | 0 | ±0 | |
| Others | 65,858 | 2.9 | -0.4 | 31 | 1.6 | ±0 | 0 | ±0 | |
| No overall control | n/a | n/a | n/a | n/a | n/a | n/a | 8 | +5 | |
- Turnout: 2,240,639 voters cast ballots, a turnout of 46.1% (-2.1%).[3]
Council results
| Council | Previous control | Result | Details | ||
|---|---|---|---|---|---|
| Barking and Dagenham
style="width: 2px; background-color: #E4003B;" data-sort-value="Labour Party (UK)" | |
Labour
style="width: 2px; background-color: #E4003B;" data-sort-value="Labour Party (UK)" | |
Labour | Details | ||
| Barnet
style="width: 2px; background-color: #0087DC;" data-sort-value="Conservative Party (UK)" | |
Conservative
style="width: 2px; background-color: black;" data-sort-value="No overall control" | |
No overall control | Details | ||
| Bexley
style="width: 2px; background-color: #0087DC;" data-sort-value="Conservative Party (UK)" | |
Conservative
style="width: 2px; background-color: black;" data-sort-value="No overall control" | |
No overall control | Details | ||
| Brent
style="width: 2px; background-color: black;" data-sort-value="No overall control" | |
No overall control
style="width: 2px; background-color: black;" data-sort-value="No overall control" | |
No overall control | Details | ||
| Bromley
style="width: 2px; background-color: #0087DC;" data-sort-value="Conservative Party (UK)" | |
Conservative
style="width: 2px; background-color: #0087DC;" data-sort-value="Conservative Party (UK)" | |
Conservative | Details | ||
| Camden
style="width: 2px; background-color: #E4003B;" data-sort-value="Labour Party (UK)" | |
Labour
style="width: 2px; background-color: #E4003B;" data-sort-value="Labour Party (UK)" | |
Labour | Details | ||
| Croydon
style="width: 2px; background-color: #0087DC;" data-sort-value="Conservative Party (UK)" | |
Conservative
style="width: 2px; background-color: #E4003B;" data-sort-value="Labour Party (UK)" | |
Labour | Details | ||
| Ealing
style="width: 2px; background-color: #0087DC;" data-sort-value="Conservative Party (UK)" | |
Conservative
style="width: 2px; background-color: #E4003B;" data-sort-value="Labour Party (UK)" | |
Labour | Details | ||
| Enfield
style="width: 2px; background-color: #0087DC;" data-sort-value="Conservative Party (UK)" | |
Conservative
style="width: 2px; background-color: #E4003B;" data-sort-value="Labour Party (UK)" | |
Labour | Details | ||
| Greenwich
style="width: 2px; background-color: #E4003B;" data-sort-value="Labour Party (UK)" | |
Labour
style="width: 2px; background-color: #E4003B;" data-sort-value="Labour Party (UK)" | |
Labour | Details | ||
| Hackney
style="width: 2px; background-color: #E4003B;" data-sort-value="Labour Party (UK)" | |
Labour
style="width: 2px; background-color: #E4003B;" data-sort-value="Labour Party (UK)" | |
Labour | Details | ||
| Hammersmith and Fulham
style="width: 2px; background-color: #E4003B;" data-sort-value="Labour Party (UK)" | |
Labour
style="width: 2px; background-color: #E4003B;" data-sort-value="Labour Party (UK)" | |
Labour | Details | ||
| Haringey
style="width: 2px; background-color: #E4003B;" data-sort-value="Labour Party (UK)" | |
Labour
style="width: 2px; background-color: #E4003B;" data-sort-value="Labour Party (UK)" | |
Labour | Details | ||
| Harrow
style="width: 2px; background-color: #0087DC;" data-sort-value="Conservative Party (UK)" | |
Conservative
style="width: 2px; background-color: black;" data-sort-value="No overall control" | |
No overall control | Details | ||
| Havering
style="width: 2px; background-color: black;" data-sort-value="No overall control" | |
No overall control
style="width: 2px; background-color: black;" data-sort-value="No overall control" | |
No overall control | Details | ||
| Hillingdon
style="width: 2px; background-color: #0087DC;" data-sort-value="Conservative Party (UK)" | |
Conservative
style="width: 2px; background-color: #E4003B;" data-sort-value="Labour Party (UK)" | |
Labour | Details | ||
| Hounslow
style="width: 2px; background-color: #E4003B;" data-sort-value="Labour Party (UK)" | |
Labour
style="width: 2px; background-color: #E4003B;" data-sort-value="Labour Party (UK)" | |
Labour | Details | ||
| Islington
style="width: 2px; background-color: #E4003B;" data-sort-value="Labour Party (UK)" | |
Labour
style="width: 2px; background-color: #E4003B;" data-sort-value="Labour Party (UK)" | |
Labour | Details | ||
| Kensington and Chelsea
style="width: 2px; background-color: #0087DC;" data-sort-value="Conservative Party (UK)" | |
Conservative
style="width: 2px; background-color: #0087DC;" data-sort-value="Conservative Party (UK)" | |
Conservative | Details | ||
| Kingston upon Thames
style="width: 2px; background-color: black;" data-sort-value="No overall control" | |
No overall control
style="width: 2px; background-color: #FAA61A;" data-sort-value="Liberal Democrats (UK)" | |
Liberal Democrats | Details | ||
| Lambeth
style="width: 2px; background-color: #E4003B;" data-sort-value="Labour Party (UK)" | |
Labour
style="width: 2px; background-color: black;" data-sort-value="No overall control" | |
No overall control | Details | ||
| Lewisham
style="width: 2px; background-color: #E4003B;" data-sort-value="Labour Party (UK)" | |
Labour
style="width: 2px; background-color: #E4003B;" data-sort-value="Labour Party (UK)" | |
Labour | Details | ||
| Merton
style="width: 2px; background-color: #E4003B;" data-sort-value="Labour Party (UK)" | |
Labour
style="width: 2px; background-color: #E4003B;" data-sort-value="Labour Party (UK)" | |
Labour | Details | ||
| Newham
style="width: 2px; background-color: #E4003B;" data-sort-value="Labour Party (UK)" | |
Labour
style="width: 2px; background-color: #E4003B;" data-sort-value="Labour Party (UK)" | |
Labour | Details | ||
| Redbridge
style="width: 2px; background-color: #0087DC;" data-sort-value="Conservative Party (UK)" | |
Conservative
style="width: 2px; background-color: black;" data-sort-value="No overall control" | |
No overall control | Details | ||
| Richmond upon Thames
style="width: 2px; background-color: #FAA61A;" data-sort-value="Liberal Democrats (UK)" | |
Liberal Democrats
style="width: 2px; background-color: #FAA61A;" data-sort-value="Liberal Democrats (UK)" | |
Liberal Democrats | Details | ||
| Southwark
style="width: 2px; background-color: #E4003B;" data-sort-value="Labour Party (UK)" | |
Labour
style="width: 2px; background-color: #E4003B;" data-sort-value="Labour Party (UK)" | |
Labour | Details | ||
| Sutton
style="width: 2px; background-color: #FAA61A;" data-sort-value="Liberal Democrats (UK)" | |
Liberal Democrats
style="width: 2px; background-color: #FAA61A;" data-sort-value="Liberal Democrats (UK)" | |
Liberal Democrats | Details | ||
| Tower Hamlets
style="width: 2px; background-color: #FAA61A;" data-sort-value="Liberal Democrats (UK)" | |
Liberal Democrats
style="width: 2px; background-color: #E4003B;" data-sort-value="Labour Party (UK)" | |
Labour | Details | ||
| Waltham Forest
style="width: 2px; background-color: #E4003B;" data-sort-value="Labour Party (UK)" | |
Labour
style="width: 2px; background-color: black;" data-sort-value="No overall control" | |
No overall control | Details | ||
| Wandsworth
style="width: 2px; background-color: #0087DC;" data-sort-value="Conservative Party (UK)" | |
Conservative
style="width: 2px; background-color: #0087DC;" data-sort-value="Conservative Party (UK)" | |
Conservative | Details | ||
| Westminster
style="width: 2px; background-color: #0087DC;" data-sort-value="Conservative Party (UK)" | |
Conservative
style="width: 2px; background-color: #0087DC;" data-sort-value="Conservative Party (UK)" | |
Conservative | Details | ||
Borough result maps
-
 Barnet 1994 results map
 -
 Camden 1994 results map
 -
 Hammersmith and Fulham 1994 results map


References
- ^ Minors, Michael; Grenham, Dennis. "London Borough Council Elections 7 May 1998 including the Greater London Authority Referendum results" (PDF). Demographic and Statistical Studies. London Research Centre. Retrieved 29 May 2014.
- ^ http://www.electionscentre.co.uk/?page_id=3755
- ^ http://londondatastore-upload.s3.amazonaws.com/docs/LBCE_1994-5-5.pdf