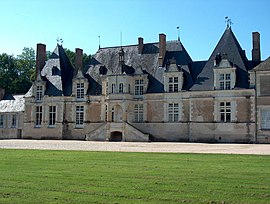
Tour-en-Sologne
Appearance
Tour-en-Sologne | |
|---|---|
Commune | |
 | |
| Coordinates: 47°32′23″N 1°30′03″E / 47.5397°N 1.5008°E | |
| Country | France |
| Region | Centre-Val de Loire |
| Department | Loir-et-Cher |
| Arrondissement | Blois |
| Canton | Chambord |
| Intercommunality | Pays de Chambord |
| Government | |
| • Mayor (2014–2020) | Robert Hutteau |
| Area 1 | 26.34 km2 (10.17 sq mi) |
| Population (2021)[1] | 1,126 |
| • Density | 43/km2 (110/sq mi) |
| Time zone | UTC+01:00 (CET) |
| • Summer (DST) | UTC+02:00 (CEST) |
| INSEE/Postal code | 41262 /41250 |
| Elevation | 72–123 m (236–404 ft) (avg. 85 m or 279 ft) |
| 1 French Land Register data, which excludes lakes, ponds, glaciers > 1 km2 (0.386 sq mi or 247 acres) and river estuaries. | |
Tour-en-Sologne is a commune of the Loir-et-Cher department in central France.
Population
| Year | Pop. | ±% |
|---|---|---|
| 1793 | 569 | — |
| 1806 | 646 | +13.5% |
| 1821 | 560 | −13.3% |
| 1831 | 603 | +7.7% |
| 1841 | 633 | +5.0% |
| 1851 | 673 | +6.3% |
| 1861 | 700 | +4.0% |
| 1872 | 707 | +1.0% |
| 1881 | 718 | +1.6% |
| 1891 | 726 | +1.1% |
| 1901 | 696 | −4.1% |
| 1911 | 619 | −11.1% |
| 1921 | 500 | −19.2% |
| 1931 | 490 | −2.0% |
| 1946 | 468 | −4.5% |
| 1954 | 473 | +1.1% |
| 1962 | 473 | +0.0% |
| 1968 | 504 | +6.6% |
| 1975 | 529 | +5.0% |
| 1982 | 726 | +37.2% |
| 1990 | 794 | +9.4% |
| 1999 | 887 | +11.7% |
| 2006 | 885 | −0.2% |
| 2015 | 1,095 | +23.7% |
See also
External links
Wikimedia Commons has media related to Tour-en-Sologne.
- ^ "Populations légales 2021" (in French). The National Institute of Statistics and Economic Studies. 28 December 2023.


