
List of parliamentary constituencies in Suffolk
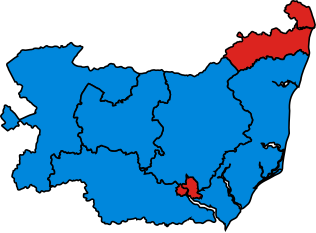
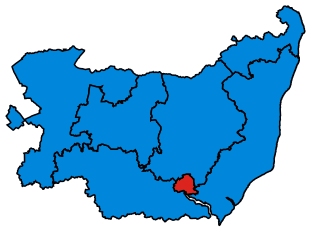
The county of Suffolk, England is divided into 7 Parliamentary constituencies – 1 Borough constituency and 6 County constituencies.
Constituencies


2010 boundary review
In the Fifth Review the Boundary Commission for England recommended that Suffolk retained its current constituencies, with changes only to reflect revisions to local authority ward boundaries. The largest of these changes resulted in the effective transfer of one Borough of Ipswich ward from Central Suffolk and North Ipswich to the constituency of Ipswich.
| Name | Boundaries 1997-2010 | Name | Boundaries 2010-present |
|---|---|---|---|
 |
 |
Proposed boundary changes
The Boundary Commission for England submitted their final proposals in respect of the Sixth Periodic Review of Westminster Constituencies (the 2018 review) in September 2018. Although the proposals were immediately laid before Parliament they were not brought forward by the Government for approval. Accordingly, they did not come into effect for the 2019 election which took place on 12 December 2019, and which was contested using the constituency boundaries in place since 2010.
Under the terms of the Parliamentary Voting System and Constituencies Act 2011, the Sixth Review was based on reducing the total number of MPs from 650 to 600 and a strict electoral parity requirement that the electorate of all constituencies should be within a range of 5% either side of the electoral quota.
On 24 March 2020, the Minister of State for the Cabinet Office, Chloe Smith, issued a written statement to Parliament setting out the Government's thinking with regard to parliamentary boundaries. They propose to bring forward primary legislation to remove the statutory obligation to implement the 2018 Boundary Review recommendations, as well as set the framework for future boundary reviews in time for the next review which is due to begin in early 2021 and report no later than October 2023. It is proposed that the number of constituencies now remains at the current level of 650, rather than being reduced to 600, while retaining the requirement that the electorate should be no more than +/- 5% from the electoral quota.[3]
Results history
Primary data source: House of Commons research briefing - General election results from 1918 to 2019[4]
2019
The number of votes cast for each political party who fielded candidates in constituencies comprising Suffolk in the 2019 general election were as follows:
| Party | Votes | % | Change from 2017 | Seats | Change from 2017 |
|---|---|---|---|---|---|
| Conservative | 229,823 | 60.1% | 7 | ||
| Labour | 91,339 | 23.9% | 0 | ||
| Liberal Democrats | 31,633 | 8.3% | 0 | 0 | |
| Greens | 24,490 | 6.4% | 0 | 0 | |
| Brexit | 1,432 | 0.4% | new | 0 | 0 |
| Others | 3,432 | 0.9% | 0 | 0 | |
| Total | 382,149 | 100.0 | 7 |
Percentage votes
| Election year | 1950 | 1951 | 1955 | 1959 | 1964 | 1966 | 1970 | 1974
(Feb) |
1974
(Oct) |
1979 | 1983 | 1987 | 1992 | 1997 | 2001 | 2005 | 2010 | 2015 | 2017 | 2019 |
|---|---|---|---|---|---|---|---|---|---|---|---|---|---|---|---|---|---|---|---|---|
| Conservative1 | 42.1 | 49.1 | 49.6 | 48.4 | 45.6 | 46.6 | 52.5 | 44.0 | 45.5 | 51.4 | 52.5 | 52.5 | 49.9 | 37.6 | 40.7 | 41.7 | 46.2 | 50.7 | 57.2 | 60.1 |
| Labour | 39.8 | 43.9 | 46.6 | 41.1 | 38.2 | 43.2 | 38.7 | 31.7 | 35.1 | 33.7 | 22.1 | 23.2 | 28.7 | 40.2 | 39.7 | 31.8 | 21.3 | 23.5 | 32.6 | 23.9 |
| Liberal Democrat2 | 18.0 | 7.0 | 3.8 | 10.5 | 16.0 | 9.9 | 8.0 | 23.7 | 19.4 | 14.4 | 25.3 | 23.6 | 20.4 | 17.6 | 16.0 | 20.6 | 24.1 | 5.6 | 4.5 | 8.3 |
| Green Party | - | - | - | - | - | - | - | - | - | - | - | * | * | * | * | * | 1.9 | 4.9 | 2.8 | 6.4 |
| UKIP | - | - | - | - | - | - | - | - | - | - | - | - | - | * | * | * | 5.3 | 15.3 | 2.3 | * |
| Brexit Party | - | - | - | - | - | - | - | - | - | - | - | - | - | - | - | - | - | - | - | 0.4 |
| Other | 0.1 | - | - | - | 0.1 | 0.3 | 0.8 | 0.5 | - | 0.5 | 0.1 | 0.6 | 1.1 | 4.6 | 3.6 | 6.0 | 1.2 | 0.1 | 0.5 | 0.9 |
1Includes National Liberal Party up to 1966
21950-1979 - Liberal; 1983 & 1987 - SDP-Liberal Alliance
* Included in Other
Seats
| Election year | 1950 | 1951 | 1955 | 1959 | 1964 | 1966 | 1970 | 1974
(Feb) |
1974
(Oct) |
1979 | 1983 | 1987 | 1992 | 1997 | 2001 | 2005 | 2010 | 2015 | 2017 | 2019 |
|---|---|---|---|---|---|---|---|---|---|---|---|---|---|---|---|---|---|---|---|---|
| Conservative1 | 2 | 3 | 3 | 4 | 4 | 4 | 5 | 5 | 4 | 4 | 5 | 6 | 5 | 5 | 5 | 5 | 7 | 7 | 6 | 7 |
| Labour | 2 | 2 | 2 | 1 | 1 | 1 | 0 | 0 | 1 | 1 | 1 | 0 | 1 | 2 | 2 | 2 | 0 | 0 | 1 | 0 |
| Liberal Democrat2 | 1 | 0 | 0 | 0 | 0 | 0 | 0 | 0 | 0 | 0 | 0 | 0 | 0 | 0 | 0 | 0 | 0 | 0 | 0 | 0 |
| Total | 5 | 5 | 5 | 5 | 5 | 5 | 5 | 5 | 5 | 5 | 6 | 6 | 6 | 7 | 7 | 7 | 7 | 7 | 7 | 7 |
1Includes National Liberal Party up to 1966
21950-1979 - Liberal; 1983 & 1987 - SDP-Liberal Alliance
Maps
-
 1950
1950 -
 1951
1951 -
1955
-
 1959
1959 -
1964
-
1966
-
 1970
1970 -
 1974 Feb
 -
 1974 Oct
 -
1979
-
 1983
1983 -
 1987
1987 -
1992
-
 1997
1997 -
2001
-
2005
-
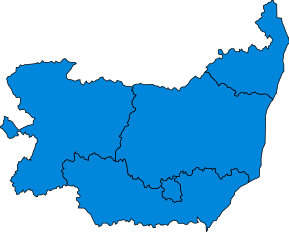
 2010
2010 -
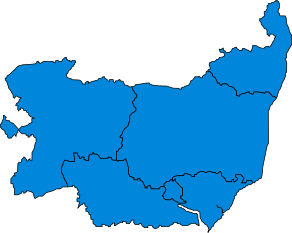
2015
-
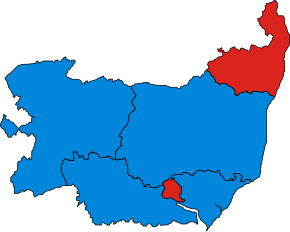
 2017
2017 -
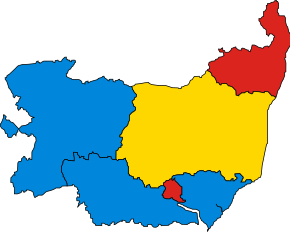
2019


Timeline
| Constituency | 1295-1298 | 1298-1529 | 1529-1559 | 1559-1571 | 1571-1614 | 1614-1832 | 1832-1844 | 1844-1885 | 1885-1918 | 1918-1950 | 1950-1983 | 1983-1997 | 1997- |
|---|---|---|---|---|---|---|---|---|---|---|---|---|---|
| Aldeburgh | 1571-1832 | ||||||||||||
| Bury St Edmunds | 1614- | ||||||||||||
| Central Suffolk | 1983-1997 | ||||||||||||
| Central Suffolk and North Ipswich | 1997- | ||||||||||||
| Dunwich | 1298-1832 | ||||||||||||
| East Suffolk | 1832-1885 | ||||||||||||
| Eye | 1571-1983 | ||||||||||||
| Ipswich | 1295- | ||||||||||||
| Lowestoft | 1885-1983 | ||||||||||||
| Orford | 1529-1832 | ||||||||||||
| South Suffolk | 1983- | ||||||||||||
| Stowmarket | 1885-1918 | ||||||||||||
| Sudbury | 1559-1844 | 1885-1950 | |||||||||||
| Sudbury and Woodbridge | 1950-1983 | ||||||||||||
| Suffolk | 1295-1832 | ||||||||||||
| Suffolk Coastal | 1983- | ||||||||||||
| Waveney | 1983- | ||||||||||||
| West Suffolk | 1832-1885 | 1997- | |||||||||||
| Woodbridge | 1885-1950 | ||||||||||||
Historical representation by party
A cell marked → (with a different colour background to the preceding cell) indicates that the previous MP continued to sit under a new party name.
1885 to 1918
Conservative Liberal Liberal Unionist
1918 to 1950
Coalition Liberal (1918-22) Conservative Independent Independent Liberal Labour Liberal National Liberal (1931-68)
1950 to present
See also
- List of Parliamentary constituencies in the East of England (region)
- History of Parliamentary constituencies and boundaries in Suffolk
Notes
References
- ^ Baker, Carl; Uberoi, Elise; Cracknell, Richard (2020-01-28). "General Election 2019: full results and analysis".
{{cite journal}}: Cite journal requires|journal=(help) - ^ a b c "Constituencies A-Z - Election 2019". BBC News. Retrieved 2020-04-23.
- ^ "Update: Strengthening Democracy:Written statement - HCWS183". UK Parliament. Retrieved 2020-04-19.
- ^ Watson, Christopher; Uberoi, Elise; Loft, Philip (2020-04-17). "General election results from 1918 to 2019".
{{cite journal}}: Cite journal requires|journal=(help)