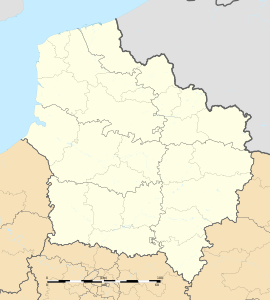
Coucy-la-Ville
Appearance
You can help expand this article with text translated from the corresponding article in French. (December 2008) Click [show] for important translation instructions.
|
Coucy-la-Ville | |
|---|---|
 The town hall of Coucy-la-Ville | |
| Coordinates: 49°32′02″N 3°19′49″E / 49.5339°N 3.3303°E | |
| Country | France |
| Region | Hauts-de-France |
| Department | Aisne |
| Arrondissement | Laon |
| Canton | Vic-sur-Aisne |
| Government | |
| • Mayor (2008–2014) | Robert Lalain |
Area 1 | 6.11 km2 (2.36 sq mi) |
| Population (2021)[1] | 195 |
| • Density | 32/km2 (83/sq mi) |
| Time zone | UTC+01:00 (CET) |
| • Summer (DST) | UTC+02:00 (CEST) |
| INSEE/Postal code | 02219 /02380 |
| Elevation | 62–175 m (203–574 ft) (avg. 80 m or 260 ft) |
| 1 French Land Register data, which excludes lakes, ponds, glaciers > 1 km2 (0.386 sq mi or 247 acres) and river estuaries. | |
Coucy-la-Ville is a commune in the Aisne department in Hauts-de-France in northern France.
On the main Chauny to Soissons road, shortly after the village of Folembray, take a right hand turn and within half a mile you will come to the village of Coucy-la-Ville.
A single road runs through this small village passing a farm, a cafe-bar and a church. Then, as suddenly as you entered, you have left this small place. Up on the hill to your right you will see the remarkable view of the remains of the Château de Coucy, located in Coucy-le-Château-Auffrique. Down in Coucy-la-Ville, the area is flat and agricultural with its few houses dotted on either side of the road.
Administration
| Period | Name | Party | Quality |
|---|---|---|---|
| 2001–2014 | Robert Lalain | ||
| Previous data not yet known. | |||
Population
| Year | Pop. | ±% |
|---|---|---|
| 1962 | 187 | — |
| 1968 | 188 | +0.5% |
| 1975 | 208 | +10.6% |
| 1982 | 196 | −5.8% |
| 1990 | 189 | −3.6% |
| 1999 | 176 | −6.9% |
| 2008 | 196 | +11.4% |
| 2012 | 216 | +10.2% |
See also
References
- ^ "Populations légales 2021" (in French). The National Institute of Statistics and Economic Studies. 28 December 2023.
Wikimedia Commons has media related to Coucy-la-Ville.


