Coventry City Council elections
Appearance
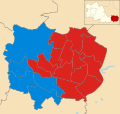
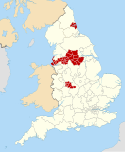
One third of Coventry City Council in the West Midlands, England is elected each year, followed by one year without election. Since the last boundary changes in 2004, 54 councillors have been elected from 18 wards.[1]
Political control
Since the first election to the council in 1973 political control of the council has been held by the following parties:[2]
| Party in control | Years |
|---|---|
| Labour | 1973 - 1978 |
| Conservative | 1978 - 1979 |
| Labour | 1979 - 2003 |
| No overall control | 2003 - 2006 |
| Conservative | 2006 - 2008 |
| No overall control | 2008 - 2010 |
| Labour | 2010–present |
Council elections
- Coventry City Council election, 1998
- Coventry City Council election, 1999
- Coventry City Council election, 2000
- Coventry City Council election, 2002
- Coventry City Council election, 2003
- Coventry City Council election, 2004 (whole council elected after boundary changes took place)[3]
- Coventry City Council election, 2006
- Coventry City Council election, 2007
- Coventry City Council election, 2008
- Coventry City Council election, 2010
- Coventry City Council election, 2011
- Coventry City Council election, 2012
- Coventry City Council election, 2015
- Coventry City Council election, 2016
- Coventry City Council election, 2018
Overview
| Year | style="background-color: Template:Conservative Party (UK)/meta/color; width: 3px;" | | Conservative | style="background-color: Template:Labour Party (UK)/meta/color; width: 3px;" | | Labour | style="background-color: Template:Liberal Democrats (UK)/meta/color; width: 3px;" | | Liberal Democrats | style="background-color: Template:Socialist Party (England and Wales)/meta/color; width: 3px;" | | Socialist | style="background-color: Template:Independent (politician)/meta/color; width: 3px;" | | Independent |
|---|---|---|---|---|---|---|---|---|---|---|
| 2015 | 13 | 41 | 0 | 0 | 0 | |||||
| 2012 | 11 | 43 | 0 | 0 | 0 | |||||
| 2011 | 17 | 35 | 1 | 1 | 0 | |||||
| 2010 | 22 | 30 | 1 | 1 | 0 | |||||
| 2008 | 27 | 24 | 1 | 2 | 0 | |||||
| 2007 | 28 | 23 | 1 | 2 | 0 | |||||
| 2006 | 29 | 19 | 2 | 3 | 1 | |||||
| 2004 | 27 | 22 | 3 | 2 | 0 | |||||
| 2003 | 23 | 26 | 2 | 3 | 0 | |||||
| 2002 | 19 | 31 | 1 | 3 | 0 | |||||
Borough result maps
-
2004 results map
-
2007 results map
-
2008 results map
-
2010 results map
-
2011 results map
By-election results
1993-1997
| Party | Candidate | Votes | % | ±% | |
|---|---|---|---|---|---|
| Labour | 1,674 | 49.0 | |||
| Conservative | 953 | 27.9 | |||
| Militant Labour | 535 | 15.6 | |||
| Liberal Democrats | 255 | 7.5 | |||
| Majority | 721 | 21.1 | |||
| Turnout | 3,417 | 28.9 | |||
| Labour hold | Swing | ||||
1997-2001
| Party | Candidate | Votes | % | ±% | |
|---|---|---|---|---|---|
| Labour | 4,801 | 63.7 | −7.2 | ||
| Conservative | 1,600 | 21.2 | +2.4 | ||
| Liberal Democrats | 1,136 | 15.1 | +4.8 | ||
| Majority | 3,201 | 42.5 | |||
| Turnout | 7,537 | 62.0 | |||
| Labour hold | Swing | ||||
| Party | Candidate | Votes | % | ±% | |
|---|---|---|---|---|---|
| Conservative | 1,741 | 61.8 | +11.9 | ||
| Labour | 673 | 23.9 | −7.8 | ||
| Liberal Democrats | 360 | 12.8 | −5.6 | ||
| Socialist Alliance | 44 | 1.6 | +1.6 | ||
| Majority | 1,068 | 37.9 | |||
| Turnout | 2,818 | 22.2 | |||
| Conservative hold | Swing | ||||
2001-2005
| Party | Candidate | Votes | % | ±% | |
|---|---|---|---|---|---|
| Labour | 2,998 | 46.9 | −5.2 | ||
| Conservative | 2,146 | 33.6 | −23.2 | ||
| Liberal Democrats | 987 | 15.5 | +13.9 | ||
| Unknown | 257 | 4.0 | +4.0 | ||
| Majority | 852 | 13.3 | |||
| Turnout | 6,388 | ||||
| Labour hold | Swing | ||||
| Party | Candidate | Votes | % | ±% | |
|---|---|---|---|---|---|
| Labour | Tony Skipper | 873 | 53.5 | +2.2 | |
| Liberal Democrats | Peter Simpson | 442 | 27.1 | +11.8 | |
| Conservative | Gary Ridley | 316 | 19.4 | −8.4 | |
| Majority | 431 | 26.4 | |||
| Turnout | 1,631 | 13.0 | |||
| Labour hold | Swing | ||||
2006-2011
| Party | Candidate | Votes | % | ±% | |
|---|---|---|---|---|---|
| Labour | Catherine Elizabeth Miks | 1,366 | 53.9 | −3.3 | |
| Conservative | Jaswant Singh Birdi | 563 | 22.2 | −0.1 | |
| Socialist Alternative | Robert McArdle | 254 | 10.0 | +3.6 | |
| BNP | Keith Oxford | 149 | 5.9 | +0.2 | |
| Green | Laura Vesty | 114 | 4.5 | −3.2 | |
| Liberal Democrats | Mark Edward Widdop | 79 | 3.1 | N/A | |
| Majority | 803 | 31.7 | |||
| Turnout | 2,532 | 18.51 | |||
| Labour hold | Swing | ||||
2016-2021
| Party | Candidate | Votes | % | ±% | |
|---|---|---|---|---|---|
| Labour | Rupinder Singh | 1,237 | |||
| Conservative | Ellane Francoise Yebkal | 344 | |||
| UKIP | Harjinder Singh Sehmi | 290 | |||
| Green | Aimee Challenor | 165 | |||
| Liberal Democrats | Christopher Mark Glenn | 124 | |||
| Majority | 893 | ||||
| Turnout | 2,160 | ||||
| Labour hold | Swing | ||||
References
- ^ "Coventry City Council". Coventry City Council. Archived from the original on 5 May 2010. Retrieved 7 May 2010.
{{cite web}}: Italic or bold markup not allowed in:|publisher=(help); Unknown parameter|deadurl=ignored (|url-status=suggested) (help) - ^ "Coventry". BBC News Online. 19 April 2009. Retrieved 7 May 2010.
{{cite news}}: Italic or bold markup not allowed in:|publisher=(help) - ^ "Coventry council". BBC News Online. Retrieved 7 May 2010.
{{cite news}}: Italic or bold markup not allowed in:|publisher=(help) - ^ "Tony's win keeps Labour hold". Coventry Evening Telegraph. 21 September 2001. p. 5.
- ^ "Notice of By-election". Coventry City Council. 1 September 2011. Archived from the original on 23 July 2012. Retrieved 17 September 2011.
{{cite web}}: Unknown parameter|deadurl=ignored (|url-status=suggested) (help) - ^ "Statement of Persons Nominated". Coventry City Council. 9 September 2011. Archived from the original on 23 July 2012. Retrieved 17 September 2011.
{{cite web}}: Unknown parameter|deadurl=ignored (|url-status=suggested) (help) - ^ "Statement of results". Coventry City Council. 7 October 2011. Retrieved 8 October 2011.
- ^ "Labour win by-election after deputy leader's death". Coventry Telegraph. 13 February 2016. p. 8.


