Division of Wentworth

Coordinates: 33°52′59″S 151°15′11″E / 33.883°S 151.253°E / -33.883; 151.253
From Wikipedia, the free encyclopedia

Wentworth
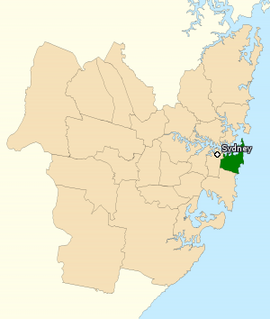
Division of Wentworth in New South Wales, as of the 2016 federal election
Created1901
MPAllegra Spender
PartyIndependent
NamesakeWilliam Charles Wentworth
Electors103,709 (2022)
Area38 km2 (14.7 sq mi)
DemographicInner metropolitan

The Division of Wentworth is an Australian electoral division in the state of New South Wales. The division encompasses the suburbs to the east of Sydney CBD, mostly Woollahra and Waverley council in Sydney's Eastern Suburbs.

History[edit]

William Charles Wentworth, the division's namesake

The division was proclaimed in 1900 and was one of the original 65 divisions contested at the first federal election. The division is named after William Charles Wentworth (1790–1872), an Australian explorer and statesman. In 1813 he accompanied Blaxland and Lawson on their crossing of the Blue Mountains.

Historically considered a safe seat for the Liberal Party of Australia and its predecessors, Wentworth is one of only two original federation divisions in New South Wales, along with the Division of North Sydney, which have never been held by the Australian Labor Party, though Labor candidate Jessie Street came within 1.6 percent of winning Wentworth at the 1943 election landslide. The electorate is the nation's wealthiest, contains the nation's largest Jewish population and contains the nation's fifth-largest number of same-sex couples.[1]

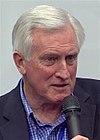
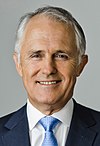
Its most prominent member was Malcolm Turnbull, who served as Leader of the Opposition from 2008 to 2009 and as Prime Minister of Australia from September 2015 until August 2018. Other prominent members have included Sir Eric Harrison, who was the first Deputy of the Liberal Party; Les Bury and Bob Ellicott, who both served as prolific ministers in successive Liberal governments of the 1960s and 1970s; Peter Coleman, who had served as New South Wales Opposition Leader from 1977 until he lost his seat in the 1978 state election; and John Hewson, who served as Opposition Leader from 1990 to 1994. Like Turnbull after him, Hewson served as federal Liberal leader whilst in his second term as the MP for Wentworth.

In August 2018, a challenge by Peter Dutton led to two Liberal leadership spills. Following the second spill on 24 August 2018, Treasurer Scott Morrison defeated Dutton in a leadership ballot. Turnbull did not nominate as a candidate, and immediately resigned as Prime Minister. On 31 August 2018 Turnbull resigned from Parliament,[2] triggering the 2018 Wentworth by-election on 20 October 2018,[3] which was won by independent candidate Kerryn Phelps.[4] Phelps narrowly lost her seat to Liberal Dave Sharma in the 2019 Australian federal election.

Sharma lost the seat in the May 2022 Australian federal election to "teal independent" Allegra Spender amid the Liberal collapse in the North Shore.[5] The swing against the Liberals was large enough to make Wentworth marginal against Labor in a "traditional" two-party contest for the first time since 1943; on paper, Sharma's margin against Labor was pared down to 5.9 percent.

Boundaries[edit]

Since 1984, federal electoral division boundaries in Australia have been determined at redistributions by a redistribution committee appointed by the Australian Electoral Commission. Redistributions occur for the boundaries of divisions in a particular state, and they occur every seven years, or sooner if a state's representation entitlement changes or when divisions of a state are malapportioned.[6]

Wentworth is the second-smallest geographical electoral division in the Parliament with an area of just 38 square kilometres (15 sq mi), covering Woolloomooloo along the southern shore of Sydney Harbour to Watsons Bay and down the coast to Clovelly—an area largely coextensive with Sydney's Eastern Suburbs. The western boundary runs along Oxford Street, Flinders Street and South Dowling Street, then eastward along Alison Road to Randwick Racecourse and Clovelly Beach. It includes the suburbs of Bellevue Hill, Ben Buckler, Bondi, Bondi Beach, Bondi Junction, Bronte, Centennial Park, Darling Point, Double Bay, Dover Heights, Edgecliff, Moore Park, North Bondi, Paddington, Point Piper, Queens Park, Rose Bay, Rushcutters Bay, Tamarama, Vaucluse, Watsons Bay, Waverley and Woollahra; as well as parts of Clovelly, Darlinghurst, East Sydney, Elizabeth Bay, Kings Cross, Potts Point and Randwick.

Members[edit]

Image Member Party Term Notes
  Sir William McMillan
(1850–1926)
Free Trade 29 March 1901
23 November 1903
Previously held the New South Wales Legislative Assembly seat of Burwood. Retired
  Willie Kelly
(1877–1960)
Free Trade 16 December 1903
1906
Served as minister under Cook. Retired
  Anti-Socialist 1906 –
26 May 1909
  Commonwealth Liberal 26 May 1909 –
17 February 1917
  Nationalist 17 February 1917 –
3 November 1919
  Walter Marks
(1875–1951)
Nationalist 13 December 1919
September 1929
Lost seat
  Independent Nationalist September 1929 –
2 December 1929
  Australian 2 December 1929 –
September 1930
  Independent September 1930 –
7 May 1931
  United Australia 7 May 1931 –
19 December 1931
  (Sir) Eric Harrison
(1892–1974)
United Australia 19 December 1931
21 February 1945
Served as minister under Lyons, Page, Menzies and Fadden. Resigned to become the High Commissioner to the United Kingdom
  Liberal 21 February 1945 –
17 October 1956
  Les Bury
(1913–1986)
Liberal 8 December 1956
11 April 1974
Served as minister under Menzies, Holt, McEwen, Gorton and McMahon. Lost preselection and retired
  Bob Ellicott
(1927–2022)
Liberal 18 May 1974
17 February 1981
Served as minister under Fraser. Resigned to become a judge on the Federal Court
  Peter Coleman
(1928–2019)
Liberal 11 April 1981
5 June 1987
Previously held the New South Wales Legislative Assembly seat of Fuller. Retired
  John Hewson
(1946–)
Liberal 11 July 1987
28 February 1995
Served as Opposition Leader from 1990 to 1994. Resigned to retire from politics
  Andrew Thomson
(1961–)
Liberal 8 April 1995
8 October 2001
Served as minister under Howard. Lost preselection and retired
  Peter King
(1952–)
Liberal 10 November 2001
3 September 2004
Lost preselection and then lost seat
  Independent 3 September 2004 –
9 October 2004
  Malcolm Turnbull
(1954–)
Liberal 9 October 2004
31 August 2018
Served as minister under Howard and Abbott. Served as Opposition Leader from 2008 to 2009. Served as Prime Minister from 2015 to 2018. Resigned to retire from politics
  Kerryn Phelps
(1957–)
Independent 20 October 2018
18 May 2019
Lost seat
  Dave Sharma
(1975–)
Liberal 18 May 2019
21 May 2022
Lost seat
  Allegra Spender
(1978–)
Independent 21 May 2022
present
Incumbent

Election results[edit]

2022 Australian federal election: Wentworth[7]
Party Candidate Votes % ±%
Liberal Dave Sharma 35,995 40.48 −6.96
Independent Allegra Spender 31,810 35.77 +35.77
Labor Tim Murray 9,654 10.86 −0.09
Greens Dominic Wy Kanak 7,410 8.33 +0.80
United Australia Natalie Dumer 1,813 2.04 +1.34
Liberal Democrats Daniel Lewkovitz 1,346 1.51 +1.51
One Nation Dean Fisher 895 1.01 +1.01
Total formal votes 88,923 97.50 +0.49
Informal votes 2,277 2.50 −0.49
Turnout 91,200 87.93 −1.47
Notional two-party-preferred count
Liberal Dave Sharma 49,727 55.92 −3.93
Labor Tim Murray 39,196 44.08 +3.93
Two-candidate-preferred result
Independent Allegra Spender 48,186 54.19 +54.19
Liberal Dave Sharma 40,737 45.81 −5.50
Independent gain from Liberal  

Referendum and plebiscite results[edit]

Same-sex marriage survey, 2017[8]
Choice Votes %
Referendum passed Yes 69,279 80.85
No 16,410 19.15
Valid votes 85,689 99.81
Invalid or blank votes 162 0.19
Total votes 85,851 100.00
Registered voters/turnout 103,972 82.57
Australian republic referendum, 1999[9]
Choice Votes %
Referendum passed Yes 46,013 60.19
No 30,435 39.81
Valid votes 76,448 99.19
Invalid or blank votes 624 0.81
Total votes 77,072 100.00
Registered voters/turnout 82,922 92.95
Preamble to the Constitution referendum, 1999[10]
Choice Votes %
Referendum passed Yes 38,360 50.31
No 37,882 49.69
Valid votes 76,242 99.01
Invalid or blank votes 763 0.99
Total votes 77,005 100.00
Registered voters/turnout 82,922 92.86
1988 Australian referendum (Rights and Freedoms)[11]
Choice Votes %
Referendum failed No 37,973 67.95
Yes 17,909 32.05
Valid votes 55,882 98.80
Invalid or blank votes 677 1.20
Total votes 56,559 100.00
Registered voters/turnout 66,520 85.03
1988 Australian referendum (Local Government)[11]
Choice Votes %
Referendum failed No 37,871 67.68
Yes 18,083 32.32
Valid votes 55,954 98.93
Invalid or blank votes 605 1.07
Total votes 56,559 100.00
Registered voters/turnout 66,520 85.03
1988 Australian referendum (Fair Elections)[11]
Choice Votes %
Referendum failed No 34,617 61.84
Yes 21,360 38.16
Valid votes 55,977 98.97
Invalid or blank votes 582 1.03
Total votes 56,559 100.00
Registered voters/turnout 66,520 85.03
1988 Australian referendum (Parliamentary Terms)[11]
Choice Votes %
Referendum failed No 37,226 66.50
Yes 18,752 33.50
Valid votes 55,978 98.97
Invalid or blank votes 581 1.03
Total votes 56,559 100.00
Registered voters/turnout 66,520 85.03
1984 Australian referendum (Interchange of Powers)[11]
Choice Votes %
Referendum failed No 34,435 57.83
Yes 25,107 42.17
Valid votes 59,542 94.90
Invalid or blank votes 3,201 5.10
Total votes 62,743 100.00
Registered voters/turnout 70,417 89.10
1984 Australian referendum (Terms of Senators)[11]
Choice Votes %
Referendum failed No 34,165 56.48
Yes 26,322 43.52
Valid votes 60,487 96.40
Invalid or blank votes 2,256 3.60
Total votes 62,743 100.00
Registered voters/turnout 70,417 89.10
1977 Australian referendum (Retirement of Judges)[11]
Choice Votes %
Referendum passed Yes 39,582 83.33
No 7,916 16.67
Valid votes 47,498 98.64
Invalid or blank votes 654 1.36
Total votes 48,152 100.00
Registered voters/turnout 56,285 85.55
1977 Australian referendum (Referendums)[11]
Choice Votes %
Referendum passed Yes 40,832 85.98
No 6,659 14.02
Valid votes 47,491 98.63
Invalid or blank votes 661 1.37
Total votes 48,152 100.00
Registered voters/turnout 56,285 85.55
1977 Australian referendum (Senate Casual Vacancies)[11]
Choice Votes %
Referendum passed Yes 39,189 82.48
No 8,322 17.52
Valid votes 47,511 98.67
Invalid or blank votes 641 1.33
Total votes 48,152 100.00
Registered voters/turnout 56,285 85.55
1977 Australian referendum (Simultaneous Elections)[11]
Choice Votes %
Referendum passed Yes 32,819 69.09
No 14,682 30.91
Valid votes 47,501 98.65
Invalid or blank votes 651 1.35
Total votes 48,152 100.00
Registered voters/turnout 56,285 85.55
1974 Australian referendum (Local Government Bodies)[11]
Choice Votes %
Referendum failed No 32,229 64.8
Yes 17,443 35.12
Valid votes 49,672 98.41
Invalid or blank votes 803 1.59
Total votes 50,475 100.00
Registered voters/turnout 53,576 94.21
1974 Australian referendum (Democratic Elections)[11]
Choice Votes %
Referendum failed No 32,247 64.86
Yes 17,468 35.14
Valid votes 49,715 98.49
Invalid or blank votes 760 1.51
Total votes 50,475 100.00
Registered voters/turnout 53,576 94.21
1974 Australian referendum (Mode of Altering the Constitution)[11]
Choice Votes %
Referendum failed No 31,721 63.78
Yes 18,012 36.22
Valid votes 49,733 98.53
Invalid or blank votes 742 1.47
Total votes 50,475 100.00
Registered voters/turnout 53,576 94.21
1974 Australian referendum (Simultaneous Elections)[11]
Choice Votes %
Referendum failed No 31,895 64.20
Yes 17,788 35.80
Valid votes 49,683 98.43
Invalid or blank votes 792 1.57
Total votes 50,475 100.00
Registered voters/turnout 53,576 94.21
1973 Australian referendum (Incomes)[11]
Choice Votes %
Referendum failed No 33,042 69.05
Yes 14,811 30.95
Valid votes 47,853 98.93
Invalid or blank votes 519 1.07
Total votes 48,372 100.00
Registered voters/turnout 55,115 87.77
1973 Australian referendum (Prices)[11]
Choice Votes %
Referendum failed No 30,971 64.67
Yes 16,921 35.33
Valid votes 47,892 99.01
Invalid or blank votes 480 0.99
Total votes 48,372 100.00
Registered voters/turnout 55,115 87.77
1967 Australian referendum (Aboriginals)[11]
Choice Votes %
Referendum passed Yes 33.420 94.91
No 1,761 5.09
Valid votes 35,211 98.98
Invalid or blank votes 364 1.02
Total votes 35,575 100.00
Registered voters/turnout 39,965 89.02
1967 Australian referendum (Parliament)[11]
Choice Votes %
Referendum passed Yes 21,294 60.53
No 13,884 39.47
Valid votes 35,178 98.88
Invalid or blank votes 397 1.12
Total votes 35,575 100.00
Registered voters/turnout 39,965 89.02
1951 Australian Communist Party ban referendum[11]
Choice Votes %
Referendum passed Yes 25,813 70.38
No 10,863 29.62
Valid votes 36,676 98.87
Invalid or blank votes 419 1.13
Total votes 37,095 100.00
Registered voters/turnout 39,312 94.36
1948 Australian rents and prices referendum[11]
Choice Votes %
Referendum failed No 46,764 64.60
Yes 25,626 35.40
Valid votes 72,390 98.63
Invalid or blank votes 1,008 1.37
Total votes 73,398 100.00
Registered voters/turnout 79,526 92.29
1946 Australian referendum (Industrial Employment)[11]
Choice Votes %
Referendum failed No 40,868 57.12
Yes 30,678 42.88
Valid votes 71,546 93.38
Invalid or blank votes 5,075 6.62
Total votes 76,621 100.00
Registered voters/turnout 81,677 93.81
1946 Australian referendum (Marketing)[11]
Choice Votes %
Referendum failed No 41,493 56.90
Yes 31,434 43.10
Valid votes 72,927 95.18
Invalid or blank votes 3,694 4.82
Total votes 76,621 100.00
Registered voters/turnout 81,677 93.81
1946 Australian referendum (Social Services)[11]
Choice Votes %
Referendum failed No 39,654 54.20
Yes 33,506 45.80
Valid votes 73,160 95.48
Invalid or blank votes 3,461 4.52
Total votes 76,621 100.00
Registered voters/turnout 81,677 93.81
1944 Australian Post-War Reconstruction and Democratic Rights referendum[11]
Choice Votes %
Referendum failed No 44,405 60.06
Yes 29,527 39.94
Valid votes 73,932 98.82
Invalid or blank votes 885 1.18
Total votes 74,817 100.00
Registered voters/turnout 76,199 98.19
1937 Australian referendum (Marketing)[11]
Choice Votes %
Referendum failed No 32,479 63.78
Yes 18,446 36.22
Valid votes 50,925 93.14
Invalid or blank votes 3,752 6.6
Total votes 54,677 100.00
Registered voters/turnout 58,531 93.42
1937 Australian referendum (Aviation)[11]
Choice Votes %
Referendum passed Yes 32,894 62.52
No 19,722 37.48
Valid votes 52,616 96.23
Invalid or blank votes 2,061 3.77
Total votes 54,677 100.00
Registered voters/turnout 58,531 93.42
1928 Australian referendum (State Debts)[11]
Choice Votes %
Referendum passed Yes 34,216 71.44
No 13,679 28.56
Valid votes 47,895 95.14
Invalid or blank votes 2,444 4.86
Total votes 50,339 100.00
Registered voters/turnout 56,093 89.74
1926 Australian referendum (Essential Services)[11]
Choice Votes %
Referendum passed Yes 25,913 62.04
No 15,854 37.96
Valid votes 41,767 96.32
Invalid or blank votes 1,597 3.68
Total votes 43,364 100.00
Registered voters/turnout 49,139 88.25
1926 Australian referendum (Industry and Commerce)[11]
Choice Votes %
Referendum passed Yes 26,401 62.36
No 15,938 37.64
Valid votes 42,339 97.64
Invalid or blank votes 1,025 2.36
Total votes 43,364 100.00
Registered voters/turnout 49,139 88.25
1919 Australian referendum (Monopolies)[11]
Choice Votes %
Referendum failed No 15,708 54.16
Yes 13,294 45.84
Valid votes 29,002 84.40
Invalid or blank votes 5,359 15.60
Total votes 34,361 100.00
Registered voters/turnout 53,804 63.86
1919 Australian referendum (Legislative Powers)[11]
Choice Votes %
Referendum failed No 16,337 52.47
Yes 14,797 47.53
Valid votes 31,134 90.61
Invalid or blank votes 3,227 9.39
Total votes 34,361 100.00
Registered voters/turnout 53,804 63.86
1917 Australian conscription referendum[11]
Choice Votes %
Referendum passed Yes 18,168 52.78
No 16,256 47.22
Valid votes 34,424 96.57
Invalid or blank votes 1,222 3.43
Total votes 35,646 100.00
Registered voters/turnout 51,514 69.20
1916 Australian conscription referendum[11]
Choice Votes %
Referendum passed Yes 20,246 53.82
No 17,374 46.18
Valid votes 37,620 95.90
Invalid or blank votes 1,610 4.10
Total votes 39,230 100.00
Registered voters/turnout 48,651 80.64
1913 Australian referendum (Monopolies)[11]
Choice Votes %
Referendum failed No 16,852 60.46
Yes 11,020 39.54
Valid votes 27,872 90.97
Invalid or blank votes 2,766 9.03
Total votes 30,638 100.00
Registered voters/turnout 43,061 71.15
1913 Australian referendum (Trusts)[11]
Choice Votes %
Referendum failed No 17,570 60.27
Yes 11,583 39.73
Valid votes 29,153 95.15
Invalid or blank votes 1,485 4.5
Total votes 30,638 100.00
Registered voters/turnout 43,061 71.15
1913 Australian referendum (Railway Disputes)[11]
Choice Votes %
Referendum failed No 17,802 61.08
Yes 11,341 38.92
Valid votes 29,143 95.12
Invalid or blank votes 1,495 4.88
Total votes 30,638 100.00
Registered voters/turnout 43,061 71.15
1913 Australian referendum (Industrial Matters)[11]
Choice Votes %
Referendum failed No 17,754 60.85
Yes 11,424 39.15
Valid votes 29,178 95.23
Invalid or blank votes 1,460 4.77
Total votes 30,638 100.00
Registered voters/turnout 43,061 71.15
1913 Australian referendum (Corporations)[11]
Choice Votes %
Referendum failed No 17,547 60.54
Yes 11,435 39.46
Valid votes 28,982 94.59
Invalid or blank votes 1,656 5.41
Total votes 30,638 100.00
Registered voters/turnout 43,061 71.15
1913 Australian referendum (Trade and Commerce)[11]
Choice Votes %
Referendum failed No 17,709 60.71
Yes 11,461 39.29
Valid votes 29,170 95.21
Invalid or blank votes 1,468 4.79
Total votes 30,638 100.00
Registered voters/turnout 43,061 71.15
1911 Australian referendum (Monopolies)[11]
Choice Votes %
Referendum failed No 13,306 72.46
Yes 5,058 27.54
Valid votes 18,364 99.22
Invalid or blank votes 144 0.78
Total votes 18,508 100.00
Registered voters/turnout 39,399 46.99
1911 Australian referendum (Trade and Commerce)[11]
Choice Votes %
Referendum failed No 13,551 73.80
Yes 4,812 26.20
Valid votes 18,363 99.22
Invalid or blank votes 144 0.78
Total votes 18,507 100.00
Registered voters/turnout 39,399 46.99
1910 Australian referendum (State Debts)[11]
Choice Votes %
Referendum failed No 11,682 63.81
Yes 6,626 36.19
Valid votes 18,308 94.62
Invalid or blank votes 1,041 5.38
Total votes 19,349 100.00
Registered voters/turnout 35,944 53.83
1910 Australian referendum (Surplus Revenue)[11]
Choice Votes %
Referendum passed Yes 11,303 61.37
No 7,116 38.63
Valid votes 18,419 95.19
Invalid or blank votes 930 4.81
Total votes 19,349 100.00
Registered voters/turnout 35,944 53.83
1906 Australian referendum (Senate elections)[11]
Choice Votes %
Referendum passed Yes 11,084 84.85
No 1,979 15.15
Valid votes 13,063 87.11
Invalid or blank votes 1,933 12.89
Total votes 14,996 100.00
Registered voters/turnout 28,500 52.75

References[edit]

  1. ^ Bowe, William (20 October 2018). "2018 Wentworth by-election". The Poll Bludger. Retrieved 30 October 2018.
  2. ^ Hutchens, Gareth (27 August 2018). "Malcolm Turnbull to trigger byelection by quitting parliament on Friday". The Guardian. Retrieved 27 August 2018.
  3. ^ "2018 Wentworth by-election - ABC News (Australian Broadcasting Corporation)". ABC News.
  4. ^ "Commentary - ABC News (Australian Broadcasting Corporation)". ABC News.
  5. ^ Wang, Jessica (22 May 2022). "Outgoing Wentworth MP Dave Sharma's extreme reaction after Allegra Spender wins". news.com.au. Retrieved 8 August 2022.
  6. ^ Muller, Damon (14 November 2017). "The process of federal redistributions: a quick guide". Parliament of Australia. Retrieved 19 April 2022.
  7. ^ Wentworth, NSW, 2022 Tally Room, Australian Electoral Commission.
  8. ^ "Results and Publications". marriagesurvey.abs.gov.au. Retrieved 4 September 2023. For breakdown of results by electorate download the Response.xls file and refer to table 2
  9. ^ "1999 Referendum Report and Statistics; Summary of Results – Republic Question". Australian Electoral Commission. Retrieved 4 September 2023.
  10. ^ "1999 Referendum Report and Statistics; Summary of Results – Preamble Question". Australian Electoral Commission. Retrieved 4 September 2023.
  11. ^ a b c d e f g h i j k l m n o p q r s t u v w x y z aa ab ac ad ae af ag ah ai aj ak al am an ao ap aq ar "Data repository". Tally Room. Australian Electoral Commission. Retrieved 4 September 2023 – via Ben Raue. To access divisional results, access the 'Australian Referendums 1906-2017' google drive link and then refer to 'Aus-Referendums-Division'

External links[edit]

33°52′59″S 151°15′11″E / 33.883°S 151.253°E / -33.883; 151.253