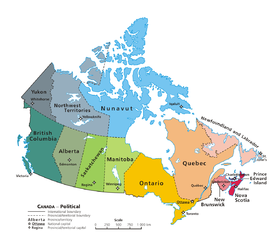
List of Canadian provinces by unemployment rate
The list of Canadian provinces by unemployment rate are statistics that directly refer to the nation's seasonally adjusted unemployment rate. Below is a comparison of the seasonally adjusted unemployment rates by province/territory, sortable by name or unemployment rate. Data provided by Statistics Canada's Labour Force Survey.[1] Not seasonally adjusted data reflects the actual current unemployment rate, while seasonally adjusted data removes the seasonal component from the information.
Unemployment by province/territory
Statistic set below: June 2016.
Note: Statistics for the territories (i.e. Yukon, Northwest Territories, and Nunavut) are not seasonally adjusted.
| Province/territory | Unemployment rate (seasonally adjusted) |
Monthly percent change ( |
|---|---|---|
| 6.9[2] | ||
| 5.9 | ||
| 7.9 | ||
| 6.1 | ||
| 6.1 | ||
| 6.4 | ||
| 7.0 | ||
| 10.3 | ||
| 11.0 | ||
| 8.2 | ||
| 12.0 | ||
| 5.5[3] | ||
| 8.0 | ||
| 13.5 |
Definitions of modern full employment range from 3% to 6% unemployment rates. As of 2016, the fastest growing economies are in Ontario and B.C..
Data differences from US rates
Canada uses a different measure to gauge the unemployment rate than the United States calculation. An analyst with the American Bureau of Labour Statistics stated that if the Canadian unemployment rate were adjusted to U.S. concepts, it would be reduced by 1 percentage point.[4]
In Canada, 15-year-olds are included in surveys of the working age population and therefore are included in their calculations. In the United States, 15-year-olds are not included in the calculations. A larger contributor to the difference is that flipping through the want-ads in a newspaper (or on the internet) gets people classified as unemployed in Canada, but not in the United States. A rise in the use of these passive job search methods in Canada is important as an explanation for the methodology bump of +1% for the Canadian figures.[4]
Unemployment extremes
The lowest level of national unemployment came in 1947 with a 2.2% unemployment rate that came as a result from the prosperity that emerged after the Second World War.
The highest level of unemployment throughout Canada was set on December 1982, when the early 1980s recession resulted in 13.1% of the adult population being out of work due to economic factors that originated in the United States.[5] The primary cause of the early 1980s recession was a contractionary monetary policy established by the Federal Reserve System to control high inflation.[6]
During the Great Depression, urban unemployment throughout Canada was 19%; Toronto's rate was 17%, according to the census of 1931. Farmers who stayed on their farms were not considered unemployed.[7]
Future labour shortages
The current unemployment rates for each province/territory, in addition to the national unemployment rate, do not take into account the labour shortages that will occur due to Canada's low birth rate and aging population. Until recently, Canada's official retirement age was 65 but the prerequisite to collect Canada Pension Plan payments and a basic old age pension has been raised to 67 in order to keep aging workers on the job for a longer period of time.[8]
The summer of 2020 will see the unemployment rate in Canada drop to nearly zero percent as young workers entering the workforce fail to keep up with the elderly workers retiring by the thousands. Ontario, for example, will see 190,000 job positions go unfilled.[9] Canada will have as many as 1.8 million jobs without the right quality of people to apply for them by 2030.
This will put Canada in a "severe labour shortage" situations; and desperate measures like hiring foreign workers for one year at a time and re-educating unskilled workers into skilled workers will be the agenda for most companies during this era.[10] Companies may also want to implement robotics in certain industries; as it may replace the falling number of workers that human resource managers cannot scout from trade schools, colleges, or local universities.
References
- ^ Labour force characteristics by province – Seasonally adjusted . Statistics Canada. Accessed 2012-12-07.
- ^ "Statistics Canada".
- ^ "Labour force characteristics, unadjusted, by territory (3 month moving average)". Statistics Canada. Retrieved 2 April 2015.
- ^ a b MILES CORAK (May 4, 2012). "A fast way to lower jobless rate: Use U.S. metrics". Globe and Mail.
- ^ "Canadian Unemployment Rates". Dave Manuel. Retrieved October 11, 2012.
- ^ "The downturn was precipitated by a rise in interest rates to levels that exceeded the record rates recorded a year earlier." Congressional Budget Office, "The Prospects for Economic Recovery," February 1982.
- ^ Canada, Bureau of the Census, Unemployment Vol. VI (Ottawa 1931), 1,267
- ^ HEATHER SCOFFIELD. "Budget changes old age security eligibility to age 67". The Chronicle Herald. The Canadian Press. Retrieved October 11, 2012.
- ^ "Throw Away Those Lemons, There's A Labour Shortage Coming". Talent Egg. Retrieved September 6, 2012.
- ^ "People without Jobs; Jobs without People" (PDF). Colleges Ontario. Retrieved September 6, 2012.

