Deep-ocean Assessment and Reporting of Tsunamis


Deep-ocean Assessment and Reporting of Tsunamis (DART) is a component of an enhanced tsunami warning system.
By logging changes in seafloor temperature and pressure, and transmitting the data via a surface buoy to a ground station by satellite, DART enables instant, accurate tsunami forecasts. In Standard Mode, the system logs the data at 15-minute intervals, and in Event Mode, every 15 seconds. A 2-way communication system allows the ground station to switch DART into Event Mode whenever detailed reports are needed.
Stations
[edit]Each DART station consists of a surface buoy and a seafloor bottom pressure recording (BPR) package that detects water pressure changes caused by tsunamis. The surface buoy receives transmitted information from the BPR via an acoustic link and then transmits data to a satellite, which retransmits the data to ground stations for immediate dissemination to NOAA's Tsunami Warning Centers, NOAA's National Data Buoy Center, and NOAA's Pacific Marine Environmental Laboratory (PMEL). The Iridium commercial satellite phone network is used for communication with 31 of the buoys.[1]
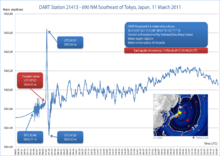
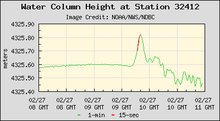
When on-board software identifies a possible tsunami, the station leaves standard mode and begins transmitting in event mode. In standard mode, the station reports water temperature and pressure (which are converted to sea-surface height, not unlike a depth gauge or a pressure tide gauge) every 15 minutes. At the start of event mode, the buoy reports measurements every 15 seconds for several minutes, followed by 1-minute averages for 4 hours.[2]
The first-generation DART I stations had one-way communication ability, and relied solely on the software's ability to detect a tsunami to trigger event mode and rapid data transmission. In order to avoid false positives, the detection threshold was set relatively high, presenting the possibility that a tsunami with a low amplitude could fail to trigger the station.
The second-generation DART II is equipped for two-way communication, allowing tsunami forecasters to place the station in event mode in anticipation of a tsunami's arrival.
Deep-ocean Assessment and Reporting of Tsunamis is officially abbreviated and trademarked as DART.[3]
Background
[edit]National Oceanic and Atmospheric Administration's NOAA have placed Deep-ocean Assessment and Reporting of Tsunami stations in particular areas, areas with a history of generating large tsunamis, to be completely positive that the detection of tsunamis are to be as fast as possible. The year of 2001 was the completion of the first six tsunami detection buoys placed along the northern Pacific Ocean coast. In 2005 the United States president George W. Bush announced a two-year, $3.5 million, plan to install tsunami detecting buoys in the Atlantic and the Caribbean ocean in order to expand the nation's capabilities to detect tsunamis. With the Pacific Ocean creating 85 percent of the world's tsunamis[4] , the majority of new tsunami detecting buoy equipment will be installed around the pacific rim, while only seven buoys will be placed along the Atlantic and Caribbean coast because even though tsunamis are rare in the Atlantic, there have been records of deadly tsunamis being reported in the Atlantic. Roughly $13.8 million of the governments funding was used to procure and install exactly 32 pressure sensors on the ocean bottom to detect tsunamis and collect data such as the height and speed of the approaching tsunami. This proposed system, stated by the John H. Marburger the White House's Office of Science and Technology Policy, should provide the United States' Tsunami Warning Centers with nearly one hundred percent coverage for any approaching tsunamis as well as decline all false alarms to just about zero.[4] During all these improvements and upgrades of the current system, roughly three fourths of the tsunami warnings were discovered to be unnecessary and a waste of money. A few years later in 2008 there are now roughly 40 tsunami detection buoys placed in the Pacific Ocean by NOAA. The upgraded DART buoys were originally developed to maintain but to mostly improve the timing of detection of a tsunami. With an improved detection time for tsunamis, that is more time to save lives, warning guidance and international coordination.
History
[edit]The DART buoy technology was developed at PMEL,[5] with the first prototype deployed off the coast of Oregon in 1995. In 2004, the DART® stations were transitioned from research at PMEL to operational service at the National Data Buoy Center (NDBC), and PMEL and NDBC received the Department of Commerce Gold Medal "for the creation and use of a new moored buoy system to provide accurate and timely warning information on tsunamis".[6]
In the wake of the 2004 Indian Ocean earthquake and its subsequent tsunamis, plans were announced to deploy an additional 32 DART II buoys around the world.[7] These would include stations in the Caribbean and Atlantic Ocean for the first time.
The United States' array was completed in 2008 totaling 39 stations in the Pacific Ocean, Atlantic Ocean, and Caribbean Sea. The international community has also taken an interest in DART buoys and as of 2009 Australia, Chile, Indonesia and Thailand have deployed DART buoys to use as part of each country's tsunami warning system.
Overview
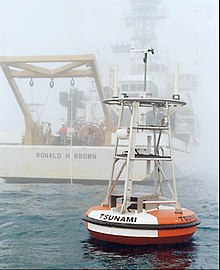
[edit]Deep-ocean Assessment and Reporting of Tsunami (DART) buoy systems are made up of three parts. There is a bottom pressure recorder (BPR) anchored to the bottom of the sea floor. A moored surface buoy connects to the bottom pressure recorder via an acoustic transmission link. The link sends data from the anchored pressure recorder to the surface buoy. The surface buoy sends the data by radio to satellites such as the Iridium system. From the satellites, the data travels by radio to the ground, then to the system office by conventional telecommunications.[8]
The surface buoy has a two and a half meter diameter fiberglass disk covered with foam and has a gross displacement of 4000 kg.[9] The mooring line connecting the surface buoy and the pressure recorder is a nineteen millimeter nylon line that has a tensile strength of 7100 kg.[9]
The data sent from the anchored bottom pressure recorder to the surface buoy consists of the temperature and pressure of the surrounding sea water. It retrieves and releases data every 15 seconds to get an average reading of the current weather conditions.[10]
A very stable, long lived, very high resolution pressure sensor is a critical enabling technology for DART's bottom pressure recorder.[11] It is a resonant quartz crystal strain gauge with a bourdon tube force collector. When compensated for temperature, this sensor has a pressure resolution of approximately 1mm of water when measuring pressure at a depth of several kilometers.[12]
Once the data reaches the surface buoy, the pressure data is converted to an average height of the waves surrounding the buoy. The temperature of the surrounding sea water is important to the calculations because temperature affects the water's density, thus the pressure, and therefore the sea temperature is required to accurately measure the height of the ocean swells. Because the swell sizes of the ocean vary constantly, the system has two modes of reporting data, standard mode and event mode.[13] Standard mode is the more common mode. Every 15 minutes, it sends the estimated sea surface height and the time of the measurement.[8]
If the software receives data that is not within the recent data averages, the system automatically switches to event mode. Event mode transmits data every 15 seconds and calculates the average sea surface height and the time when data being recorded every minute. If no further data is received that is not out of the averages being calculated at the time, it switches back to standard mode after four hours.[13] When NOAA released the first six DART buoys, their system only had a one way communication system. It was not until 2005 when the first generation of the DART buoy was upgraded to the second generation of the DART buoy. After 2005 the Dart buoys started using Iridium communication satellites that enabled you to not only retrieve information but to also send information to a DART.[14] The two-way communications between Tsunami Warning Centers and the pressure recorder made it possible to manually set DART buoys in event mode in case of any suspicion of a possible in-coming tsunamis. To make sure communications are always in contact and secure, the DART buoys have two communication systems; two independent and a redundant communication system.[14] With these updated and reliable communicating systems, data can now be sent where it needs to be sent around the world.
See also
[edit]References
[edit]- ^ Iridium tracks tsunami buoys for NOAA
- ^ "NDBC – Deep-ocean Assessment and Reporting of Tsunamis (DART®) Description". Archived from the original on 2010-03-06. Retrieved 2010-03-01.
- ^ DART website with Patent Licensing Application form
- ^ a b (January 15, 2005 Saturday). Tsunami Detection To Expand; More Protection for U.S. Coastal Areas. The Washington Post, Retrieved from www.lexisnexis.com/hottopics/lnacademic
- ^ DART development Publications & References, 2011-11-15
- ^ Note: The Gold Medal is granted for distinguished contributions and is the highest honorary recognition bestowed by the Department of Commerce. Because so many people contributed to this success, the Gold Medal was presented as an organizational award.
- ^ "NOAA News Online (Story 2369)". Archived from the original on 2005-01-19. Retrieved 2005-01-15.
- ^ a b (2015). Deep Ocean Tsunami Detection Buoys. Australian Government; Bureau of Meteorology. http://www.bom.gov.au/tsunami/about/detection_buoys.shtml
- ^ a b Meinig, C., S.E. Stalin, A.I. Nakamura, H.B. Milburn (2005), Real-Time Deep-Ocean Tsunami Measuring, Monitoring, and Reporting System: The NOAA DART II Description and Disclosure.
- ^ Deep-ocean Assessment and Reporting of Tsunamis (DART®) Description. (2011, July 27). Retrieved March 24, 2015, from http://www.ndbc.noaa.gov/dart/dart.shtml Archived 2010-03-06 at the Wayback Machine
- ^ Milburn, Hugh. "The NOAA DART II Description and Disclosure" (PDF). noaa.gov. NOAA, U.S. Government. Retrieved 4 April 2020.
- ^ Eble, M. C.; Gonzalez, F. I. "Deep-Ocean Bottom Pressure Measurements in the Northeast Pacific" (PDF). noaa.gov. NOAA, U.S. Government. Retrieved 4 April 2020.
- ^ a b Deep-ocean Assessment and Reporting of Tsunamis (DART®) Description. (2011, July 27). Retrieved April 21, 2015, from http://www.ndbc.noaa.gov/dart/dart.shtml Archived 2010-03-06 at the Wayback Machine
- ^ a b Mungov, G., Eblé, M., & Bouchard, R. (2013). DART Tsunameter Retrospective and Real-Time Data: A Reflection on 10 Years of Processing in Support of Tsunami Research and Operations. Pure & Applied Geophysics, 170(9/10), 1369-1384. doi:10.1007/s00024-012-0477-5
External links
[edit]- NOAA NDBC Deep-ocean Assessment and Reporting of Tsunamis (DART)
- NOAA Center for Tsunami Research Deep-ocean Assessment and Reporting of Tsunamis (DART)
- Realtime DART buoy data Archived 2010-06-03 at the Wayback Machine from the National Data Buoy Center
- High-resolution archived data from the National Centers for Environmental Information
- Social & Economic Benefits of the DART system from "NOAA Socioeconomics" website initiative
- NOAA Tsunami website
- National Tsunami Hazard Mitigation Program


