1964 United States presidential election in New Mexico
| ||||||||||||||||||||||||||
| ||||||||||||||||||||||||||
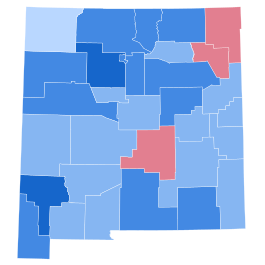
 County results
| ||||||||||||||||||||||||||
| ||||||||||||||||||||||||||
| Elections in New Mexico |
|---|
 |
The 1964 United States presidential election in New Mexico took place on November 3, 1964. All fifty states and The District of Columbia, were part of the 1964 United States presidential election. State voters chose four electors to represent them in the Electoral College, who voted for president and vice president.
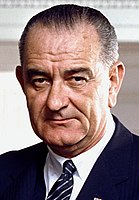
New Mexico was won by President Lyndon B. Johnson in a 19-point landslide. Johnson had won after serving as President for one year following the Assassination of John F. Kennedy. Arizona Senator Barry Goldwater lost most of the United States in this election, except for his home state and portions of the American South.[1] Goldwater won only three counties: the Plains counties of Union and Harding, which as of the 2020 presidential election[update] have never voted Democratic since 1948,[2] and Lincoln County, which has never voted Democratic since 1936. Even in these, Goldwater won only narrowly: his highest proportion of the vote was only 52.55 percent in Lincoln County. Four other normally reliably Republican counties – San Juan, Curry, Chaves and Catron – were narrowly won by Johnson and have never voted for a Democrat since.[2] This is also the last time the southeastern counties of Roosevelt, Otero and Lea have voted Democratic. Los Alamos County did not vote Democratic again until 2008.[2]
At the other extreme, Grant and Sandoval Counties both gave Johnson over seventy percent of the vote, and the populous counties of Santa Fe and Taos also gave him over two-thirds.[1]
Results
[edit]| Party | Candidate | Votes | % | ±% | |
|---|---|---|---|---|---|
| Democratic |
|
194,017 | 59.22% | +9.07 | |
| Republican | 131,838 | 40.24% | −9.17 | ||
| Socialist Labor | 1,217 | 0.37% | +0.19 | ||
| Prohibition |
|
543 | 0.17% | −0.08 | |
| Total votes | 327,615 | 100.00% | |||
| Democratic win | |||||
Results by county
[edit]| County[3] | Lyndon B. Johnson Democratic |
Barry Goldwater Republican |
Eric Hass Socialist Labor |
E. Harold Munn Prohibition |
Margin | Total votes cast | |||||
|---|---|---|---|---|---|---|---|---|---|---|---|
| # | % | # | % | # | % | # | % | # | % | ||
| Bernalillo | 55,036 | 55.98% | 42,583 | 43.31% | 624 | 0.63% | 74 | 0.08% | 12,453 | 12.67% | 98,317 |
| Catron | 624 | 51.66% | 584 | 48.34% | 0 | 0.00% | 0 | 0.00% | 40 | 3.32% | 1,208 |
| Chaves | 8,650 | 50.55% | 8,419 | 49.20% | 29 | 0.17% | 14 | 0.08% | 231 | 1.35% | 17,112 |
| Colfax | 3,367 | 66.95% | 1,636 | 32.53% | 8 | 0.16% | 18 | 0.36% | 1,731 | 34.42% | 5,029 |
| Curry | 5,228 | 50.38% | 5,120 | 49.34% | 14 | 0.13% | 16 | 0.15% | 108 | 1.04% | 10,378 |
| De Baca | 674 | 54.35% | 559 | 45.08% | 3 | 0.24% | 4 | 0.32% | 115 | 9.27% | 1,240 |
| Dona Ana | 10,748 | 59.43% | 7,280 | 40.25% | 42 | 0.23% | 15 | 0.08% | 3,468 | 19.18% | 18,085 |
| Eddy | 11,216 | 62.20% | 6,747 | 37.42% | 45 | 0.25% | 24 | 0.13% | 4,469 | 24.78% | 18,032 |
| Grant | 5,253 | 71.82% | 2,042 | 27.92% | 12 | 0.16% | 7 | 0.10% | 3,211 | 43.90% | 7,314 |
| Guadalupe | 1,649 | 60.78% | 1,058 | 39.00% | 2 | 0.07% | 4 | 0.15% | 591 | 21.78% | 2,713 |
| Harding | 431 | 47.62% | 473 | 52.27% | 1 | 0.11% | 0 | 0.00% | -42 | -4.65% | 905 |
| Hidalgo | 995 | 60.89% | 628 | 38.43% | 8 | 0.49% | 3 | 0.18% | 367 | 22.46% | 1,634 |
| Lea | 8,862 | 55.57% | 7,033 | 44.10% | 36 | 0.23% | 17 | 0.11% | 1,829 | 11.47% | 15,948 |
| Lincoln | 1,565 | 46.70% | 1,761 | 52.55% | 13 | 0.39% | 12 | 0.36% | -196 | -5.85% | 3,351 |
| Los Alamos | 3,767 | 66.23% | 1,895 | 33.32% | 6 | 0.11% | 20 | 0.35% | 1,872 | 32.91% | 5,688 |
| Luna | 2,286 | 57.60% | 1,665 | 41.95% | 12 | 0.30% | 6 | 0.15% | 621 | 15.65% | 3,969 |
| McKinley | 6,913 | 69.13% | 2,965 | 29.65% | 64 | 0.64% | 58 | 0.58% | 3,948 | 39.48% | 10,000 |
| Mora | 1,509 | 59.72% | 1,014 | 40.13% | 2 | 0.08% | 2 | 0.08% | 495 | 19.59% | 2,525 |
| Otero | 6,035 | 63.13% | 3,498 | 36.59% | 13 | 0.14% | 14 | 0.15% | 2,537 | 26.54% | 9,560 |
| Quay | 2,333 | 51.67% | 2,161 | 47.86% | 13 | 0.29% | 8 | 0.18% | 172 | 3.81% | 4,515 |
| Rio Arriba | 6,787 | 69.56% | 2,906 | 29.78% | 32 | 0.33% | 32 | 0.33% | 3,881 | 39.78% | 9,757 |
| Roosevelt | 2,875 | 51.03% | 2,732 | 48.49% | 20 | 0.35% | 7 | 0.12% | 143 | 2.54% | 5,634 |
| San Juan | 6,901 | 49.68% | 6,808 | 49.01% | 86 | 0.62% | 97 | 0.70% | 93 | 0.67% | 13,892 |
| San Miguel | 5,767 | 67.81% | 2,714 | 31.91% | 20 | 0.24% | 4 | 0.05% | 3,053 | 35.90% | 8,505 |
| Sandoval | 3,332 | 75.38% | 1,077 | 24.37% | 10 | 0.23% | 1 | 0.02% | 2,255 | 51.01% | 4,420 |
| Santa Fe | 12,616 | 68.12% | 5,834 | 31.50% | 35 | 0.19% | 34 | 0.18% | 6,782 | 36.62% | 18,519 |
| Sierra | 1,633 | 51.86% | 1,501 | 47.67% | 12 | 0.38% | 3 | 0.10% | 132 | 4.19% | 3,149 |
| Socorro | 2,397 | 57.33% | 1,774 | 42.43% | 5 | 0.12% | 5 | 0.12% | 623 | 14.90% | 4,181 |
| Taos | 4,204 | 67.39% | 2,006 | 32.16% | 10 | 0.16% | 18 | 0.29% | 2,198 | 35.23% | 6,238 |
| Torrance | 1,446 | 54.88% | 1,183 | 44.90% | 3 | 0.11% | 3 | 0.11% | 263 | 9.98% | 2,635 |
| Union | 1,159 | 48.27% | 1,232 | 51.31% | 7 | 0.29% | 3 | 0.12% | -73 | -3.04% | 2,401 |
| Valencia | 7,757 | 65.98% | 3,950 | 33.60% | 30 | 0.26% | 20 | 0.17% | 3,807 | 32.38% | 11,757 |
| Totals | 194,017 | 59.22% | 131,838 | 40.24% | 1,217 | 0.37% | 543 | 0.17% | 62,179 | 18.98% | 327,615 |
Counties that flipped from Republican to Democratic
[edit]References
[edit]- ^ a b "1964 Presidential General Election Results – New Mexico". Dave Leip’s Atlas of U.S. Presidential Elections. Retrieved April 27, 2013.
- ^ a b c Sullivan, Robert David; ‘How the Red and Blue Map Evolved Over the Past Century’; America Magazine in The National Catholic Review; June 29, 2016.
- ^ Our Campaigns; NM US President 1964


