
Biological data visualization: Difference between revisions
Citation bot (talk | contribs) Alter: title. Add: chapter. Removed parameters. | Use this bot. Report bugs. | #UCB_CommandLine |
Added "Systems biology" section to cover sys bio imaging in more depth due to its relevance to biological data visualization |
||
| Line 1: | Line 1: | ||
{{Short description|Branch of bioinformatics}} |
{{Short description|Branch of bioinformatics}} |
||
''' |
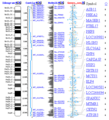
'''Biological data visualization''' is a branch of [[bioinformatics]] concerned with the application of [[computer graphics]], [[scientific visualization]], and [[information visualization]] to different areas of the [[life sciences]]. This includes visualization of [[sequences]], [[genomes]], [[sequence alignment|alignments]], [[phylogenies]], [[macromolecules|macromolecular structures]], [[systems biology]], [[microscopy]], and [[magnetic resonance imaging]] data. Software tools used for visualizing biological data range from simple, standalone programs to complex, integrated systems. |
||
==Systems biology== |
|||
[[Systems biology]] is a branch of biological data visualization dedicated to analyzing and modeling complex biological systems. Popular computational models used in systems biology include [[process calculi]], such as stochastic [[π-calculus]], and constraint-based reconstruction and analysis (COBRA), a paradigm that considers physical, enzymatic, and topological constraints underlying a [[phenotype]] in a [[metabolic network]].<ref>{{cite web |url=https://pubmed.ncbi.nlm.nih.gov/17045684/ |title=Text mining and its potential applications in systems biology |last=Ananiadou |first=Sophia |publisher=Trends in Biotechnology |date=October 12, 2006 |website=National Library of Medicine |access-date=April 14, 2024}}</ref><ref>{{cite web |url=https://link.springer.com/referenceworkentry/10.1007/978-1-4419-9863-7_1143 |title=Constraint-based Modeling |last=Resendis-Antonio |first=Osbaldo |publisher=Springer Nature |website=Springer |access-date=April 14, 2024}}</ref> |
|||
One of the most popular classes of systems biology is [[metabolomics]]. Modern metabolomics imaging uses [[mass spectrometry]] to measure metabolite distribution information, then converts the peak intensity associated with the measurement point into an image.<ref>{{cite web |url=https://www.shimadzu.com/an/industries/life-science/life-science-metabolomics/imaging-metabolomics/index.html |title=Imaging Metabolomics |website=Shimadzu |access-date=4/15/2024}}</ref> Metabolic phenotypes can also be modeled and predicted with genome-scale models using COBRA methods, especially [[flux balance analysis]] (FBA).<ref>{{cite web |url=https://www.ncbi.nlm.nih.gov/pmc/articles/PMC3108565/ |title=What is flux balance analysis? |last=Orth |first=Jeffrey D |publisher=Nature Biotechnology |date=March 28, 2010 |website=National Library of Medicine |access-date=April 14, 2024}}</ref> |
|||
Popular software tools used in systems biology modeling include [https://pubmed.ncbi.nlm.nih.gov/33507922/ massPy], [https://pubmed.ncbi.nlm.nih.gov/17855418/ Cytosim], and [https://pubmed.ncbi.nlm.nih.gov/23423320/ PySB]. Further examples may be found at Wikipedia's [[list of systems biology modeling software]]. |
|||
==State-of-the-art and perspectives== |
==State-of-the-art and perspectives== |
||
Revision as of 17:33, 15 April 2024
Biological data visualization is a branch of bioinformatics concerned with the application of computer graphics, scientific visualization, and information visualization to different areas of the life sciences. This includes visualization of sequences, genomes, alignments, phylogenies, macromolecular structures, systems biology, microscopy, and magnetic resonance imaging data. Software tools used for visualizing biological data range from simple, standalone programs to complex, integrated systems.
Systems biology
Systems biology is a branch of biological data visualization dedicated to analyzing and modeling complex biological systems. Popular computational models used in systems biology include process calculi, such as stochastic π-calculus, and constraint-based reconstruction and analysis (COBRA), a paradigm that considers physical, enzymatic, and topological constraints underlying a phenotype in a metabolic network.[1][2]
One of the most popular classes of systems biology is metabolomics. Modern metabolomics imaging uses mass spectrometry to measure metabolite distribution information, then converts the peak intensity associated with the measurement point into an image.[3] Metabolic phenotypes can also be modeled and predicted with genome-scale models using COBRA methods, especially flux balance analysis (FBA).[4]
Popular software tools used in systems biology modeling include massPy, Cytosim, and PySB. Further examples may be found at Wikipedia's list of systems biology modeling software.
State-of-the-art and perspectives
Today we are experiencing a rapid growth in volume and diversity of biological data, presenting an increasing challenge for biologists. A key step in understanding and learning from these data is visualization. Thus, there has been a corresponding increase in the number and diversity of systems for visualizing biological data.
An emerging trend is the blurring of boundaries between the visualization of 3D structures at atomic resolution, visualization of larger complexes by cryo-electron microscopy, and visualization of the location of proteins and complexes within whole cells and tissues.[5][6]
A second emerging trend is an increase in the availability and importance of time-resolved data from systems biology, electron microscopy[7][8] and cell and tissue imaging. In contrast, visualization of trajectories has long been a prominent part of molecular dynamics.
Finally, as datasets are increasing in size, complexity, and interconnectedness, biological visualization systems are improving in usability, data integration and standardization.
List of visualization software
This section needs expansion. You can help by adding to it. (December 2009) |
Many software systems are available for visualization biological data.[9][10][11][12] The list below links some popularly used software, and systems grouped by application areas.
- Medusa - A simple tool for interaction graph analysis.[13] It is a Java based application and available as an applet.
- Cytoscape - An open source software for integrating bio-molecular interaction networks with high-throughput expression data and other molecular states.[14]
- Proviz - ProViz is a standalone open source application under the GPL license.[15]
- PATIKA - It is a tool with integrated visual environment for collaborative construction and analysis of cellular pathways.[16]
-
 Genomic and assembly data
 -
 Alignments, phylogeny and evolution
 -

-

-
-


References
- ^ Ananiadou, Sophia (October 12, 2006). "Text mining and its potential applications in systems biology". National Library of Medicine. Trends in Biotechnology. Retrieved April 14, 2024.
- ^ Resendis-Antonio, Osbaldo. "Constraint-based Modeling". Springer. Springer Nature. Retrieved April 14, 2024.
- ^ "Imaging Metabolomics". Shimadzu. Retrieved 4/15/2024.
{{cite web}}: Check date values in:|access-date=(help) - ^ Orth, Jeffrey D (March 28, 2010). "What is flux balance analysis?". National Library of Medicine. Nature Biotechnology. Retrieved April 14, 2024.
- ^ Lucić V, Förster F, Baumeister W (2005). "Structural studies by electron tomography: from cells to molecules". Annual Review of Biochemistry. 74: 833–65. doi:10.1146/annurev.biochem.73.011303.074112. PMID 15952904.
- ^ Steven AC, Baumeister W (September 2008). "The future is hybrid". Journal of Structural Biology. 163 (3): 186–95. doi:10.1016/j.jsb.2008.06.002. PMID 18602011. S2CID 2432954.
- ^ Plattner H, Hentschel J (2006). "Sub-Second Cellular Dynamics: Time-Resolved Electron Microscopy and Functional Correlation". A Survey of Cell Biology (Submitted manuscript). International Review of Cytology. Vol. 255. pp. 133–76. doi:10.1016/S0074-7696(06)55003-X. ISBN 9780123735997. PMID 17178466.
- ^ Frank J, Schlichting I (September 2004). "Time-resolved imaging of macromolecular processes and interactions". Journal of Structural Biology. 147 (3): 209–10. doi:10.1016/j.jsb.2004.06.003. PMID 15450290.
- ^ Pavlopoulos GA, Malliarakis D, Papanikolaou N, Theodosiou T, Enright AJ, Iliopoulos I (2015). "Visualizing genome and systems biology: technologies, tools, implementation techniques and trends, past, present and future". GigaScience. 4: 38. doi:10.1186/s13742-015-0077-2. PMC 4548842. PMID 26309733.
- ^ Pavlopoulos GA, Wegener AL, Schneider R (November 2008). "A survey of visualization tools for biological network analysis". BioData Mining. 1: 12. doi:10.1186/1756-0381-1-12. PMC 2636684. PMID 19040716.
- ^ Pavlopoulos GA, Soldatos TG, Barbosa-Silva A, Schneider R (February 2010). "A reference guide for tree analysis and visualization". BioData Mining. 3 (1): 1. doi:10.1186/1756-0381-3-1. PMC 2844399. PMID 20175922.
- ^ Pavlopoulos GA, Iacucci E, Iliopoulos I, Bagos P (2013). "Interpreting the Omics 'era' Data". Multimedia Services in Intelligent Environments. Smart Innovation, Systems and Technologies. Vol. 25. pp. 79–100. doi:10.1007/978-3-319-00375-7_6. ISBN 978-3-319-00374-0.
- ^ Hooper SD, Bork P (December 2005). "Medusa: a simple tool for interaction graph analysis". Bioinformatics. 21 (24): 4432–3. doi:10.1093/bioinformatics/bti696. PMID 16188923.
- ^ Shannon P, Markiel A, Ozier O, Baliga NS, Wang JT, Ramage D, et al. (November 2003). "Cytoscape: a software environment for integrated models of biomolecular interaction networks". Genome Research. 13 (11): 2498–504. doi:10.1101/gr.1239303. PMC 403769. PMID 14597658.
- ^ Iragne F, Nikolski M, Mathieu B, Auber D, Sherman D (January 2005). "ProViz: protein interaction visualization and exploration". Bioinformatics. 21 (2): 272–4. doi:10.1093/bioinformatics/bth494. PMID 15347570.
- ^ Demir E, Babur O, Dogrusoz U, Gursoy A, Nisanci G, Cetin-Atalay R, Ozturk M (July 2002). "PATIKA: an integrated visual environment for collaborative construction and analysis of cellular pathways". Bioinformatics. 18 (7): 996–1003. doi:10.1093/bioinformatics/18.7.996. hdl:11693/24660. PMID 12117798.
External links
Related conferences
- BioVis: Symposium on Biological Data Visualization
- Applications of Information Visualization in Bioinformatics
- CIBDV: Computational Intelligence for Biological Data Visualization
- IVBI: Information Visualization in Biomedical Informatics Symposium
- VMLS: Visualization in Medicine & Life Sciences
- VIZBI: Workshop on Visualizing Biological Data