
Super Dual Auroral Radar Network: Difference between revisions
m →External links: ion.usask.ca points to the FMCW radar system at the UofS ~~~~ |
Cleaning up the lead of the article. Reorganized some content. |
||
| Line 5: | Line 5: | ||
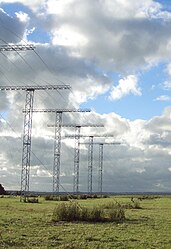
[[File:SuperDARN.jpg|thumb|right|SuperDARN site in [[Holmwood SDA, Saskatoon]]]] |
[[File:SuperDARN.jpg|thumb|right|SuperDARN site in [[Holmwood SDA, Saskatoon]]]] |
||
The '''Super Dual Auroral Radar Network''' (SuperDARN) is an international [[radar]] network for studying the upper [[atmosphere]] and [[ionosphere]], comprising twenty one radars in the [[northern hemisphere]] and eleven in the [[southern hemisphere]] <ref>http://superdarn.jhuapl.edu/info/info.html. Retrieved 2013-07-19</ref> that operate in the [[High Frequency]] (HF) bands between 8.0 [[MHz]] (37m) and 22.0 [[MHz]] (14m). |
|||
The '''Super Dual Auroral Radar Network''' (SuperDARN) is an international scientific [[radar]] network |
|||
| ⚫ | The [[Java applet]]s that are used as the radar data display system currently indicate the 10 MHz (30m) and 14 MHz (21m) frequency bands as being primarily used in 2012 (in the Northern Hemisphere). The radars measure the [[Doppler radar|Doppler velocity]] (and other related characteristics) of [[Plasma (physics)|plasma]] density irregularities in the ionosphere. |
||
<ref name=greenwald1995>{{cite journal|last1=Greenwald|first1=R.A.|title=DARN/SuperDARN|journal=Space Science Reviews|date=February 1, 1995|volume=71|issue=1-4|pages=761-796|doi=10.1007/BF00751350|accessdate=February 23, 2015}}</ref><ref name=chisham2007>{{cite journal|last1=Chisham|first1=G.|title=A decade of the Super Dual Auroral Radar Network (SuperDARN): scientific achievements, new techniques and future directions|journal=Surveys in Geophysics|date=January 1, 2007|volume=28|issue=1|pages=33-109|doi=10.1007/s10712-007-9017-8|accessdate=February 23, 2015}}</ref> |
|||
consisting of 35 |
|||
<ref name=VT SuperDARN Home> {{cite web | last = Ruohoniemi | first = M.J. | url = http://vt.superdarn.org/tiki-index.php | title = VT SuperDARN Home: Virginia Tech SuperDARN | accessdate = February 23, 2015}}</ref> |
|||
[[high-frequency]] [[radars]] located in both the Northern and Southern Hemispheres. SuperDARN radars are primarily used to map high-latitude [[Plasma (physics)|plasma]] convection in the [[F region]] of the [[ionosphere]], but the radars are also used to study a wider range of [[Outer_space#Geospace | geospace]] phenomena including: [[Birkeland_current|field aligned currents]], [[magnetic reconnection]], [[Geomagnetic_storm|geomagnetic storms]] and [[Substorm|substorms]], [[Magnetosphere|magnetospheric]] [[Magnetohydrodynamics|MHD]] waves, [[Mesosphere|mesospheric]] winds via [[Meteoroid#Meteor|meteor ionization trails]], and interhemispheric plasma convection assymetries<ref name=chisham2007></ref>. |
|||
| ⚫ | In the ''standard operating mode'' each radar scans through 16 beams of azimuthal separation ~3.24°, with a total scan time of 1 min. Each beam is divided into 75 range gates of length 45 km, and so in each full scan the radars each cover 52° in azimuth and over 3000 km in range, an area of over 4×10<sup>6</sup> km |
||
== History == |
== History == |
||
| Line 16: | Line 19: | ||
Additions to the ionospheric RADAR network (in the Northern and Southern Hemispheres) have occurred about once every 4 years. |
Additions to the ionospheric RADAR network (in the Northern and Southern Hemispheres) have occurred about once every 4 years. |
||
Since [[Linux]] became popular, it has become the default operating system for the |
Since [[Linux]] became popular, it has become the default operating system for the SuperDARN network. The operating system (superdarn-ros.3.6) is currently licensed under the [[LGPL]]). [http://superdarnx.jhuapl.edu/software/superdarn/ros/index.html] |
||
== Operations == |
|||
| ⚫ | SuperDARN radars operate in the HF band between 8.0 [[MHz]] (37m) and 22.0 [[MHz]] (14m)<ref name=chisham2007></ref>. In the ''standard operating mode'' each radar scans through 16 beams of azimuthal separation ~3.24°, with a total scan time of 1 min. Each beam is divided into 75 range gates of length 45 km, and so in each full scan the radars each cover 52° in azimuth and over 3000 km in range, an area of over 4×10<sup>6</sup> km<sup>2</sup>. |
||
| ⚫ | The [[Java applet]]s that are used as the radar data display system currently indicate the 10 MHz (30m) and 14 MHz (21m) frequency bands as being primarily used in 2012 (in the Northern Hemisphere). The radars measure the [[Doppler radar|Doppler velocity]] (and other related characteristics) of [[Plasma (physics)|plasma]] density irregularities in the ionosphere. |
||
==SuperDARN sites== |
==SuperDARN sites== |
||
Revision as of 22:31, 23 February 2015
This article has multiple issues. Please help improve it or discuss these issues on the talk page. (Learn how and when to remove these template messages)
|

The Super Dual Auroral Radar Network (SuperDARN) is an international scientific radar network
[1][2]
consisting of 35
Cite error: The <ref> tag has too many names (see the help page).
high-frequency radars located in both the Northern and Southern Hemispheres. SuperDARN radars are primarily used to map high-latitude plasma convection in the F region of the ionosphere, but the radars are also used to study a wider range of geospace phenomena including: field aligned currents, magnetic reconnection, geomagnetic storms and substorms, magnetospheric MHD waves, mesospheric winds via meteor ionization trails, and interhemispheric plasma convection assymetries[2].
History
SuperDARN began in 1983, when the first radar installation was constructed in Labrador, Canada.[3]
Additions to the ionospheric RADAR network (in the Northern and Southern Hemispheres) have occurred about once every 4 years.
Since Linux became popular, it has become the default operating system for the SuperDARN network. The operating system (superdarn-ros.3.6) is currently licensed under the LGPL). [1]
Operations
SuperDARN radars operate in the HF band between 8.0 MHz (37m) and 22.0 MHz (14m)[2]. In the standard operating mode each radar scans through 16 beams of azimuthal separation ~3.24°, with a total scan time of 1 min. Each beam is divided into 75 range gates of length 45 km, and so in each full scan the radars each cover 52° in azimuth and over 3000 km in range, an area of over 4×10⁶ km2.
The Java applets that are used as the radar data display system currently indicate the 10 MHz (30m) and 14 MHz (21m) frequency bands as being primarily used in 2012 (in the Northern Hemisphere). The radars measure the Doppler velocity (and other related characteristics) of plasma density irregularities in the ionosphere.
SuperDARN sites
The following is a list of SuperDARN sites, based on a list maintained by Virginia Tech College of Engineering.[4] As of 2009, an expansion project was underway for expanding the network into the middle latitudes, including the addition of sites in Hays, Kansas (near Fort Hays State University), Oregon, and the Azores, in order to support mapping outside of the auroral regions during large magnetic storms.[5]
*: Part of the Southern Hemisphere Auroral Radar Experiment
Coverage
Northern Hemisphere
- Because the SuperDARN network evolved in the west during the late Cold War, coverage of Russia's arctic regions is poor.
- Although there is no shortage of possible sites to cover Russia's arctic regions from Northern Europe and Alaska, the coverage would probably not be of high quality.
- So far there has been no movement within those managing the SuperDARN network to do joint ventures with Russian universities to build the Russian part of the network.
Southern Hemisphere
- Although Antarctica is covered reasonably well, the Sub-Antarctic regions do not have uniform coverage.
- Java VM real time display software interoperability (where both poles could be observed at the same time) is still a work in progress.
-
 Real Time Java applet display of SuperDARN network for the Americas
 -
 The Unwin Radar is a scientific radar array at Awarua Plain near Invercargill, New Zealand


References
- ^ Greenwald, R.A. (February 1, 1995). "DARN/SuperDARN". Space Science Reviews. 71 (1–4): 761–796. doi:10.1007/BF00751350.
{{cite journal}}:|access-date=requires|url=(help) - ^ a b c Chisham, G. (January 1, 2007). "A decade of the Super Dual Auroral Radar Network (SuperDARN): scientific achievements, new techniques and future directions". Surveys in Geophysics. 28 (1): 33–109. doi:10.1007/s10712-007-9017-8.
{{cite journal}}:|access-date=requires|url=(help) - ^ "National Science Foundation constructs radar facility on FHSU grounds; internship created". Fort Hays State University. August 27, 2009. Retrieved 2009-11-04. [dead link]
- ^ "SuperDARN". Virginia Tech. Retrieved 2015-01-07.
- ^ "APL Part of International Team Expanding Space Weather Radar Network". Johns Hopkins Applied Physics Laboratory. 2009-08-30. Retrieved 2015-01-07.
Research papers
Research papers related to SuperDARN and related technologies
Real time display of SuperDarn radar
- Realtime Java applet display (North American Arctic)
External links
Each participating university should be listed here. As these are ongoing research sites, these links are subject to change.
Northern Hemisphere Stations
- Canada : SuperDARN at University of Saskatchewan
- Canada : Canadian Space Agency SuperDARN portal
- US : VT SuperDARN at Virginia Tech
- US :SuperDARN at the University of Alaska Geophysical Institute
- US : SuperDARN at Virginia Tech
- US :SuperDARN at Dartmouth College in New Hampshire
- UK : SuperDARN UK
Southern Hemisphere Stations
- Australia : SuperDARN Tiger at Latrobe University
- ...
![]() Media related to Unwin Radar at Wikimedia Commons
Media related to Unwin Radar at Wikimedia Commons