
Qionglai City
Qionglai
邛崃市 | |||||||||||||||||||||||||||||||||||||||||||||||||||||||||||||||
|---|---|---|---|---|---|---|---|---|---|---|---|---|---|---|---|---|---|---|---|---|---|---|---|---|---|---|---|---|---|---|---|---|---|---|---|---|---|---|---|---|---|---|---|---|---|---|---|---|---|---|---|---|---|---|---|---|---|---|---|---|---|---|---|
.jpg) | |||||||||||||||||||||||||||||||||||||||||||||||||||||||||||||||
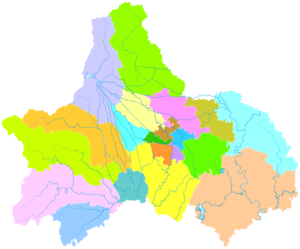
.png) Location of Qionglai in Sichuan | |||||||||||||||||||||||||||||||||||||||||||||||||||||||||||||||
 Qionglai Location in Sichuan | |||||||||||||||||||||||||||||||||||||||||||||||||||||||||||||||
| Coordinates: 30°24′22″N 103°27′32″E / 30.406°N 103.459°E[1] | |||||||||||||||||||||||||||||||||||||||||||||||||||||||||||||||
| Country | People's Republic of China | ||||||||||||||||||||||||||||||||||||||||||||||||||||||||||||||
| Province | Sichuan | ||||||||||||||||||||||||||||||||||||||||||||||||||||||||||||||
| Sub-provincial city | Chengdu | ||||||||||||||||||||||||||||||||||||||||||||||||||||||||||||||
| Area | |||||||||||||||||||||||||||||||||||||||||||||||||||||||||||||||
| • Total | 1,384 km2 (534 sq mi) | ||||||||||||||||||||||||||||||||||||||||||||||||||||||||||||||
| Population (2010)[2] | |||||||||||||||||||||||||||||||||||||||||||||||||||||||||||||||
| • Total | 612,753 | ||||||||||||||||||||||||||||||||||||||||||||||||||||||||||||||
| • Density | 443/km2 (1,150/sq mi) | ||||||||||||||||||||||||||||||||||||||||||||||||||||||||||||||
| Time zone | UTC+8 (China Standard) | ||||||||||||||||||||||||||||||||||||||||||||||||||||||||||||||
| Postal code | 6115XX | ||||||||||||||||||||||||||||||||||||||||||||||||||||||||||||||
| Chengdu district map |
| ||||||||||||||||||||||||||||||||||||||||||||||||||||||||||||||
Qionglai (simplified Chinese: 邛崃; traditional Chinese: 邛崍; pinyin: Qiónglái) is a county-level city of Sichuan Province, Southwest China, it is under the administration of the prefecture-level city of Chengdu. It is located around 60 kilometres (37 mi) from downtown Chengdu. The city is located on the western edge of the Sichuan Basin and in the foothills of the Qionglai Mountains that bound the basin from the west, and is bordered by the prefecture-level city of Ya'an to the west.
Transport

- China National Highway 318
- Rivers and Water
There are many rivers around in Qionglai City, so it has abundant water power. South River, Zhuojiang River, Xiejiang River and Pujiang River flow through this city, and they are 217.15 kilometers long in total. The quantity of runoff of surface water may reach 991 million cubic meters, including 532.8 million cubic meters which can be made use of by humans. Underground water can reach 106 million cubic meters. Surface and underground water create many opportunities to support agriculture and manufacture.
Climate
| Climate data for Qionglai (1981−2010) | |||||||||||||
|---|---|---|---|---|---|---|---|---|---|---|---|---|---|
| Month | Jan | Feb | Mar | Apr | May | Jun | Jul | Aug | Sep | Oct | Nov | Dec | Year |
| Record high °C (°F) | 19.1 (66.4) |
22.8 (73.0) |
31.6 (88.9) |
32.7 (90.9) |
35.0 (95.0) |
36.8 (98.2) |
36.0 (96.8) |
37.7 (99.9) |
36.1 (97.0) |
29.5 (85.1) |
26.2 (79.2) |
19.0 (66.2) |
37.7 (99.9) |
| Mean daily maximum °C (°F) | 9.5 (49.1) |
11.8 (53.2) |
16.4 (61.5) |
22.0 (71.6) |
26.6 (79.9) |
28.2 (82.8) |
30.0 (86.0) |
29.7 (85.5) |
25.8 (78.4) |
20.8 (69.4) |
16.2 (61.2) |
10.7 (51.3) |
20.6 (69.2) |
| Daily mean °C (°F) | 6.1 (43.0) |
8.2 (46.8) |
11.9 (53.4) |
17.0 (62.6) |
21.4 (70.5) |
23.8 (74.8) |
25.6 (78.1) |
25.1 (77.2) |
21.8 (71.2) |
17.3 (63.1) |
12.7 (54.9) |
7.4 (45.3) |
16.5 (61.7) |
| Mean daily minimum °C (°F) | 3.4 (38.1) |
5.5 (41.9) |
8.6 (47.5) |
13.2 (55.8) |
17.4 (63.3) |
20.4 (68.7) |
22.3 (72.1) |
21.8 (71.2) |
19.2 (66.6) |
15.0 (59.0) |
10.2 (50.4) |
4.9 (40.8) |
13.5 (56.3) |
| Record low °C (°F) | −4.0 (24.8) |
−2.9 (26.8) |
−0.9 (30.4) |
5.0 (41.0) |
7.0 (44.6) |
13.8 (56.8) |
16.4 (61.5) |
17.0 (62.6) |
12.3 (54.1) |
4.2 (39.6) |
0.2 (32.4) |
−4.5 (23.9) |
−4.5 (23.9) |
| Average precipitation mm (inches) | 12.9 (0.51) |
18.5 (0.73) |
32.4 (1.28) |
61.4 (2.42) |
84.9 (3.34) |
120.7 (4.75) |
222.8 (8.77) |
256.6 (10.10) |
143.3 (5.64) |
51.3 (2.02) |
23.5 (0.93) |
10.3 (0.41) |
1,038.6 (40.9) |
| Average relative humidity (%) | 84 | 82 | 80 | 79 | 76 | 81 | 85 | 85 | 85 | 86 | 85 | 85 | 83 |
| Source: China Meteorological Data Service Center[3] | |||||||||||||
See also
References
- ^ Google (2014-07-02). "Qionglai" (Map). Google Maps. Google. Retrieved 2014-07-02.
- ^ 我市2010年第六次全国人口普查数据公报 (in Simplified Chinese). Government of Chengdu. 2011-05-13. Archived from the original on September 30, 2011. Retrieved 2011-08-04.
- ^ 中国地面气候标准值月值(1981-2010) (in Simplified Chinese). China Meteorological Data Service Center. Retrieved 20 October 2018.
External links
| International | |
|---|---|
| National | |
This Sichuan location article is a stub. You can help Wikipedia by expanding it. |