2000 United States presidential election in Wyoming
| ||||||||||||||||||||||||||
| ||||||||||||||||||||||||||
 County results
Bush 50-60% 60-70% 70-80% 80-90%
| ||||||||||||||||||||||||||
| ||||||||||||||||||||||||||
| Elections in Wyoming |
|---|
 |
The 2000 United States presidential election in Wyoming took place on November 7, 2000, and was part of the 2000 United States presidential election. Voters chose three representatives, or electors to the Electoral College, who voted for president and vice president.
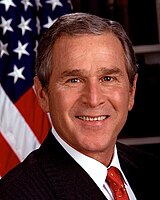
Wyoming was won by incumbent Texas Governor George W. Bush by a massive 40.06% margin of victory, and his 67.76% of the popular vote made the state his strongest victory in the 2000 election.[1] He was accompanied on the Republican ticket by vice presidential nominee Dick Cheney, formerly a member of the U.S. House of Representatives from Wyoming's at-large district. As of the 2024 presidential election[update], this is the last time a Republican won Teton County, and thus is also the last time a nominee of any party carried every county in the state, even though subsequent Republican nominees such as Donald Trump have exceeded Bush's share of the overall vote in Wyoming.
Results
[edit]| 2000 United States presidential election in Wyoming[2] | |||||
|---|---|---|---|---|---|
| Party | Candidate | Votes | Percentage | Electoral votes | |
| Republican | George W. Bush | 147,947 | 67.76% | 3 | |
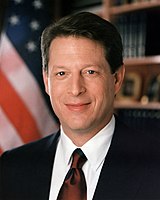
| Democratic | Al Gore | 60,481 | 27.70% | 0 | |
| Write-in | Ralph Nader | 4,625 | 2.12% | 0 | |
| Reform | Pat Buchanan | 2,724 | 1.25% | 0 | |
| Libertarian | Harry Browne | 1,443 | 0.66% | 0 | |
By county
[edit]| County | George W. Bush Republican |
Al Gore Democratic |
Various candidates Other parties |
Margin | Total votes cast | ||||
|---|---|---|---|---|---|---|---|---|---|
| # | % | # | % | # | % | # | % | ||
| Albany | 7,814 | 55.22% | 5,069 | 35.82% | 1,268 | 8.96% | 2,745 | 19.40% | 14,151 |
| Big Horn | 3,720 | 75.64% | 1,004 | 20.41% | 194 | 3.94% | 2,716 | 55.23% | 4,918 |
| Campbell | 10,203 | 81.36% | 1,967 | 15.69% | 370 | 2.95% | 8,236 | 65.67% | 12,540 |
| Carbon | 4,498 | 64.55% | 2,206 | 31.66% | 264 | 3.79% | 2,292 | 32.89% | 6,968 |
| Converse | 3,919 | 75.73% | 1,076 | 20.79% | 180 | 3.48% | 2,843 | 54.94% | 5,175 |
| Crook | 2,289 | 83.60% | 361 | 13.18% | 88 | 3.21% | 1,928 | 70.42% | 2,738 |
| Fremont | 10,560 | 68.38% | 4,172 | 27.01% | 712 | 4.61% | 6,388 | 41.37% | 15,444 |
| Goshen | 3,922 | 71.05% | 1,439 | 26.07% | 159 | 2.88% | 2,483 | 44.98% | 5,520 |
| Hot Springs | 1,733 | 73.68% | 544 | 23.13% | 75 | 3.19% | 1,189 | 50.55% | 2,352 |
| Johnson | 2,886 | 81.30% | 555 | 15.63% | 109 | 3.07% | 2,331 | 65.67% | 3,550 |
| Laramie | 21,797 | 61.71% | 12,162 | 34.43% | 1,364 | 3.86% | 9,635 | 27.28% | 35,323 |
| Lincoln | 5,415 | 79.11% | 1,184 | 17.30% | 246 | 3.59% | 4,231 | 61.81% | 6,845 |
| Natrona | 18,439 | 64.95% | 8,646 | 30.46% | 1,303 | 4.59% | 9,793 | 34.49% | 28,388 |
| Niobrara | 888 | 78.79% | 190 | 16.86% | 49 | 4.35% | 698 | 61.93% | 1,127 |
| Park | 9,884 | 77.00% | 2,424 | 18.88% | 528 | 4.11% | 7,460 | 58.12% | 12,836 |
| Platte | 2,925 | 66.89% | 1,249 | 28.56% | 199 | 4.55% | 1,676 | 38.33% | 4,373 |
| Sheridan | 8,424 | 68.85% | 3,330 | 27.21% | 482 | 3.94% | 5,094 | 41.64% | 12,236 |
| Sublette | 2,624 | 81.59% | 458 | 14.24% | 134 | 4.17% | 2,166 | 67.35% | 3,216 |
| Sweetwater | 9,425 | 60.07% | 5,521 | 35.19% | 745 | 4.75% | 3,904 | 24.88% | 15,691 |
| Teton | 5,454 | 52.29% | 4,019 | 38.53% | 958 | 9.18% | 1,435 | 13.76% | 10,431 |
| Uinta | 5,469 | 73.73% | 1,650 | 22.24% | 299 | 4.03% | 3,819 | 51.49% | 7,418 |
| Washakie | 3,138 | 77.46% | 806 | 19.90% | 107 | 2.64% | 2,332 | 57.56% | 4,051 |
| Weston | 2,521 | 82.39% | 449 | 14.67% | 90 | 2.94% | 2,072 | 67.72% | 3,060 |
| Total | 147,947 | 67.76% | 60,481 | 27.70% | 9,923 | 4.54% | 87,466 | 40.06% | 218,351 |
Counties that flipped from Democratic to Republican
[edit]- Albany (Largest city: Laramie)
- Sweetwater (Largest city: Rock Springs)
- Teton (Largest city: Jackson)
By congressional district
[edit]Due to the state's low population, only one congressional district is allocated. This district, called the At-Large district, because it covers the entire state, and thus is equivalent to the statewide election results.
| District | Bush | Gore | Representative |
|---|---|---|---|
| At-large | 67.8% | 27.7% | Barbara Cubin |
Electors
[edit]The electors of each state and the District of Columbia met on December 18, 2000[3] to cast their votes for president and vice president. The Electoral College itself never meets as one body. Instead the electors from each state and the District of Columbia met in their respective capitols.
The following were the members of the Electoral College from the state. All were pledged to and voted for George Bush and Dick Cheney:[4]
- Judy Catchpole
- Gale Geringer
- John Patton
See also
[edit]References
[edit]- ^ "2000 Presidential Election Statistics". Dave Leip’s Atlas of U.S. Presidential Elections. Retrieved March 5, 2018.
- ^ "Dave Leip's Atlas of U.S. Presidential Elections".
- ^ 2000 Presidential General Election Results - Wyoming
- ^ "President Elect - 2000". Archived from the original on March 3, 2009. Retrieved May 10, 2011.


