
Xiangcheng County, Sichuan
This article needs additional citations for verification. (January 2022) |
Xiangcheng County
乡城县 · ཕྱག་ཕྲེང་རྫོང་། | |
|---|---|
.png) Location of Xiangcheng County (red) within Garzê Prefecture (yellow) and Sichuan | |
| Country | People's Republic of China |
| Province | Sichuan |
| Autonomous prefecture | Garzê |
| Area | |
• Total | 5,016 km2 (1,937 sq mi) |
| Population | |
• Total | 30,000 (2,007) |
| Time zone | UTC+8 (China Standard) |
Xiangcheng County (simplified Chinese: 乡城县; traditional Chinese: 鄉城縣; pinyin: Xiāngchéng Xiàn; Tibetan: ཕྱག་ཕྲེང་རྫོང་།, Wylie: phyag phreng rdzong, ZYPY: Qagchêng Zong) is a county in the west of Sichuan Province, China, bordering Yunnan province to the south. It is under the administration of the Garzê Tibetan Autonomous Prefecture.
Climate
| Climate data for Xiangcheng (1981−2010) | |||||||||||||
|---|---|---|---|---|---|---|---|---|---|---|---|---|---|
| Month | Jan | Feb | Mar | Apr | May | Jun | Jul | Aug | Sep | Oct | Nov | Dec | Year |
| Record high °C (°F) | 22.0 (71.6) |
22.7 (72.9) |
27.4 (81.3) |
29.7 (85.5) |
30.5 (86.9) |
32.5 (90.5) |
34.4 (93.9) |
31.8 (89.2) |
31.0 (87.8) |
27.3 (81.1) |
23.5 (74.3) |
20.6 (69.1) |
34.4 (93.9) |
| Mean daily maximum °C (°F) | 12.0 (53.6) |
13.4 (56.1) |
16.2 (61.2) |
19.0 (66.2) |
22.9 (73.2) |
25.5 (77.9) |
24.5 (76.1) |
23.5 (74.3) |
22.3 (72.1) |
20.0 (68.0) |
15.9 (60.6) |
12.7 (54.9) |
19.0 (66.2) |
| Daily mean °C (°F) | 2.5 (36.5) |
4.7 (40.5) |
7.8 (46.0) |
11.1 (52.0) |
15.3 (59.5) |
18.3 (64.9) |
17.7 (63.9) |
16.8 (62.2) |
15.2 (59.4) |
11.6 (52.9) |
6.4 (43.5) |
2.7 (36.9) |
10.8 (51.5) |
| Mean daily minimum °C (°F) | −5.4 (22.3) |
−3.3 (26.1) |
0.3 (32.5) |
3.8 (38.8) |
8.0 (46.4) |
12.0 (53.6) |
13.0 (55.4) |
12.3 (54.1) |
10.2 (50.4) |
4.8 (40.6) |
−1.1 (30.0) |
−4.9 (23.2) |
4.1 (39.4) |
| Record low °C (°F) | −14.4 (6.1) |
−11.3 (11.7) |
−6.3 (20.7) |
−3.5 (25.7) |
−1.0 (30.2) |
3.6 (38.5) |
5.1 (41.2) |
5.6 (42.1) |
1.9 (35.4) |
−3.5 (25.7) |
−8.3 (17.1) |
−13.3 (8.1) |
−14.4 (6.1) |
| Average precipitation mm (inches) | 1.2 (0.05) |
1.4 (0.06) |
5.8 (0.23) |
11.0 (0.43) |
25.3 (1.00) |
66.2 (2.61) |
156.0 (6.14) |
127.2 (5.01) |
66.7 (2.63) |
18.4 (0.72) |
3.2 (0.13) |
0.8 (0.03) |
483.2 (19.04) |
| Average relative humidity (%) | 33 | 35 | 40 | 45 | 48 | 57 | 71 | 73 | 70 | 58 | 44 | 36 | 51 |
| Source: China Meteorological Data Service Center[1] | |||||||||||||
Terrain maps
-
 NH 47-11 (Taocheng)
 -
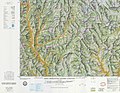 NH 47-15 (Tejung)


References
- ^ 中国地面气候标准值月值(1981-2010) (in Simplified Chinese). China Meteorological Data Service Center. Retrieved 9 November 2022.
External links
 Xiangcheng travel guide from Wikivoyage
| County-level divisions |   | |
|---|---|---|
| Towns and villages |
| |
| Geography | ||
| Landmarks | ||
| Sciences | ||
29°16′57″N 99°36′29″E / 29.2825°N 99.6081°E
| International | |
|---|---|
| National | |
This Sichuan location article is a stub. You can help Wikipedia by expanding it. |