
Talk:COVID-19 pandemic in Australia: Difference between revisions
→new cases ACT 27.3.20: new section |
Liam Skoda (talk | contribs) NSW recoveries |
||
| Line 218: | Line 218: | ||
:Recovered numbers are remarkably similar to cases for 14 days earlier, which is what you would expect. It suggests that over time recoveries are reported.--[[User:Grahamec|Grahame]] ([[User talk:Grahamec|talk]]) 01:59, 26 March 2020 (UTC) |
:Recovered numbers are remarkably similar to cases for 14 days earlier, which is what you would expect. It suggests that over time recoveries are reported.--[[User:Grahamec|Grahame]] ([[User talk:Grahamec|talk]]) 01:59, 26 March 2020 (UTC) |
||
::Thanks [[User:Grahamec|Grahame]], good observation. Will continue to monitor it and re-visit the topic if it doesn't appear to be keeping up. [[User:Clifton9|Clifton9]] ([[User talk:Clifton9|talk]]) 02:23, 26 March 2020 (UTC) |
::Thanks [[User:Grahamec|Grahame]], good observation. Will continue to monitor it and re-visit the topic if it doesn't appear to be keeping up. [[User:Clifton9|Clifton9]] ([[User talk:Clifton9|talk]]) 02:23, 26 March 2020 (UTC) |
||
::: NSW finally disclosed how many patients are receiving active treatment, it should be safe to assume the others have recovered. They only officially reported the original 4 patients from China. |
|||
https://www.health.nsw.gov.au/news/Pages/20200327_00.aspx |
|||
[[User:Liam Skoda|Liam Skoda]] ([[User talk:Liam Skoda|talk]]) 04:13, 27 March 2020 (UTC) |
|||
== External territories == |
== External territories == |
||
Revision as of 04:13, 27 March 2020
| This is the talk page for discussing improvements to the COVID-19 pandemic in Australia article. This is not a forum for general discussion of the article's subject. |
Article policies
|
| Find medical sources: Source guidelines · PubMed · Cochrane · DOAJ · Gale · OpenMD · ScienceDirect · Springer · Trip · Wiley · TWL |
| Archives: 1, 2, 3Auto-archiving period: 7 days |
| This article has not yet been rated on Wikipedia's content assessment scale. It is of interest to the following WikiProjects: | |||||||||||||||||||||||||||||||||||||||||||||||||||||||||||||||||||||||||||
Please add the quality rating to the {{WikiProject banner shell}} template instead of this project banner. See WP:PIQA for details.
Please add the quality rating to the {{WikiProject banner shell}} template instead of this project banner. See WP:PIQA for details.
Please add the quality rating to the {{WikiProject banner shell}} template instead of this project banner. See WP:PIQA for details.
Please add the quality rating to the {{WikiProject banner shell}} template instead of this project banner. See WP:PIQA for details.
Please add the quality rating to the {{WikiProject banner shell}} template instead of this project banner. See WP:PIQA for details.
| |||||||||||||||||||||||||||||||||||||||||||||||||||||||||||||||||||||||||||

.svg)


| Material from 2019–20 coronavirus outbreak by country and territory was split to 2020 coronavirus outbreak in Australia on 26 February 2020. The former page's history now serves to provide attribution for that content in the latter page, and it must not be deleted so long as the latter page exists. Please leave this template in place to link the article histories and preserve this attribution. The former page's talk page can be accessed at Talk:2019–20 coronavirus outbreak by country and territory. |
| This article is written in Australian English, which has its own spelling conventions (colour, realise, program, labour (but Labor Party)) and some terms that are used in it may be different or absent from other varieties of English. According to the relevant style guide, this should not be changed without broad consensus. |
| This is the talk page for discussing improvements to the COVID-19 pandemic in Australia article. This is not a forum for general discussion of the article's subject. |
Article policies
|
| Find medical sources: Source guidelines · PubMed · Cochrane · DOAJ · Gale · OpenMD · ScienceDirect · Springer · Trip · Wiley · TWL |
| Archives: 1, 2, 3Auto-archiving period: 7 days |
Total cases
@Ear-phone: I would like to ask whether the numbers of total cases are intended to represent the total cases reported at the early hours of each day as is the data released by the Department of Health, or at the end of each day. Onmaditque (talk) 08:31, 7 March 2020 (UTC)
- @Onmaditque: I think the total cases reported that are being released by the Department of Health is all cases reported before 9am that day, and each update adds the number of new reported cases and recoveries from 9am the previous day to 9am of the current day. Stevedog8 (talk) 12:11, 7 March 2020 (UTC)
I have an issue with the total number of cases. I have been extensively tracking the confirmed cases each day and have been keeping my own record of each. Earlier on, each confirmed case had gone back to their state for medical treatment. The case of the Goulburn man, whether he has returned to his home state, has been counted in the NSW tally and removed from the NT tally by the Department of Health. Since 6 March, this one particular case has been double counted in many news agency reports as one case in NSW AND one case in NT. However according to the Department of Health, he only counts as one case and their daily total as reported on their site reflects that NT currently has no cases as his case was already included in the NSW total. I was confused for some time about this and I can understand the news agencies might be too. However I was determined to understand why the figures did not correlate and after much research, I reached the above conclusions. Prior to Tasmania recording its second case, the national total stood at 70 (or 71 as incorrectly reported by many news agencies and this wiki page itself). My question is this: is this wiki page displaying the number of PEOPLE infected? 70? Or the number of cases (so the Goulburn/Darwin person is two cases) treated by each state, where this Goulburn man might be treated as both a NT case AND a NSW case? Tkh7 (talk) 09:45, 7 March 2020 (UTC)
- @Tkh7: Officially, the Goulburn man case is treated as a NSW case only and one case only, not a case in both NT and NSW. So this wiki page will display the current number of people infected by coronavirus in Australia and by state where the case is located currently (so the NT case will be counted as a NSW case as the Goulburn man is currently being treated in his home state, NSW), this is my current position on it and what should be used in future counts. Stevedog8 (talk) 11:42, 7 March 2020 (UTC)
- @Stevedog8: I agree with you. Therefore the current total for NSW is 34 regardless as it already includes the Goulburn man. However, that means the national total should then be only 70 (prior to the addition of the second Tasmania case) as 71 would be counting him twice (once for NSW and once for NT). That also means the count for NSW alone should be 34, which has been correctly reported by media outlets. 35 would be incorrect as it would mean we are counting the Goulburn man twice in the tally for NSW. Thank you. Tkh7 (talk) 11:51, 7 March 2020 (UTC)
The total number of cases on this wikipedia page as of 10:36am 11-3-2020 is 115 which may be in error as it is one less than worldometers' figure of 116. https://www.worldometers.info/coronavirus/#countries
@Tkh7: I just saw this conversation and thank you for your clarification. Both NSW and Victorian state health department have reported a Victorian resident diagnosed in NSW. This case is counted in the tally of NSW Health, but not in the tally of Victorian Department of Health & Human Services, since the Victorian resident has not yet returned to their home state. According to your rule of counting "the current number of people infected by coronavirus in Australia and by state where the case is located currently", we should not deduct one from the tally reported by NSW Health and add one to the tally reported by Victorian Department of Health & Human Services, which I have been doing. I have corrected this error and removed note c from the state-by-ate table. Onmaditque (talk) 12:25, 12 March 2020 (UTC)
- @Onmaditque: NSW Health have indicated that their tally includes a Victorian resident and Health Victoria has since confirmed that one of their "latest six cases" is the earlier confirmed Victorian resident that was originally diagnosed and counted in the NSW tally, but is now counted in the Vic tally. National figures count the case as a Vic case and not a NSW case. Therefore, from here on in, the case of this Victorian resident that was diagnosed in NSW should be counted as a Victorian case (unless otherwise described the national figures). Tkh7 (talk) 12:37, 12 March 2020 (UTC)
- @Tkh7: Health Victoria said today "The new cases include six men aged between 30-70. All cases are recovering at home in isolation. Of the six new cases, five have a history of international travel. One is a close contact of a confirmed case" and "One ADDITIONAL case is an existing case from NSW now counted in Victorian statistics, as they are a Victorian resident",[1]which means the "latest six cases" and the 27 confirmed cases do NOT include the Victorian resident diagnosed in NSW. I think after the Victorian resident returned to their home state, NSW Health will deduct them in their tally and Health Victoria will add them to their tally, just like NSW Health added the Goulburn man diagnosed in Darwin to its tally after he returned to NSW. Onmaditque (talk) 12:58, 12 March 2020 (UTC)
- @Onmaditque: I believe the important note there is the statement that you quoted: "an existing case from NSW now counted in Victorian statistics". The earlier cases were transferred to their home states for treatment AFTER they were repatriated from the Diamond Princess cruise ship and held in the Darwin quarantine centre BECAUSE of the repatriation and quarantine. This most likely will not be the case for future cases. In the case of the Victorian resident, he was not repatriated from a cruise ship or quarantined elsewhere and I don't believe they are waiting for him to return to his home state before "deducting" him from the NSW tally. I have kept a record of every case confirmed so far in Australia and this case IS included in Victoria's current tally of 27. However, if you ALSO count it in NSW (becoming a total of 78), then you are double counting a case and not accurately reflecting the number of patients confirmed. Furthermore, no cases are "removed" from tallies once they have recovered and whether or not the patient has been transferred to his home state would most likely not be mentioned any further in reports due to some organisations refusing to report on the whereabouts of their patients in respect of their privacy. Thus, if any case is a confirmed resident of one state but diagnosed in another, they should be counted in their state of residency, regardless of whether they have finished treatment. Tkh7 (talk) 13:33, 12 March 2020 (UTC)
- @Onmaditque: "Note that under National Notifiable Diseases Surveillance System reporting requirements, cases are reported based on their Australian jurisdiction of residence rather than where they were detected. For example, a case reported previously in the NT in a NSW resident is counted in the national figures as a NSW case."[2] Tkh7 (talk) 11:40, 14 March 2020 (UTC)
So far, it seems that as of yesterday, there is under-reporting. Yesterday, 3 cases were confirmed in Orange, NSW (see https://www.centralwesterndaily.com.au/story/6676758/three-confirmed-cases-of-coronavirus-in-orange/). I see no mention of this in the article. And though it is personal research (I live in Orange) and therefore not admissible, I know that 2 of these were high school students. And no-one of high school age is listed in the recent NSW cases. In addition, it would be helpful if the towns where cases occur were indicated. There is tendency in regional/rural areas to consider this a big city problem; indicating the geographical spread would help counteract this. Or a map showing the location of cases. Ptilinopus (talk) 02:36, 14 March 2020 (UTC)
@Tkh7: Under-reporting is one thing; it bothers me deeply that we are surrounded by published information to an incredible depth, and still nobody appears to be interpreting these data in a manner sufficient to instil the requisite respect. As at Saturday 02:42, 21 March 2020 (UTC), health.nsw.gov.au cite 382 confirmed cases and 6 deaths. Regardless of the specific history of each confirmed case, some not very complicated algebra informs us of a fatality rate of the order of 2% --- a more precise estimate would be appreciated. Data from China suggests a duration infection to fatality of the order of 15 days --- again, bring on a better approximations. Naively, 6 deaths and a fatality rate of 2% suggests that at least at the time that the last fatality was infected (around 7 March 2020? a time when NSW was reporting 28 confirmed cases), there could have been at least 300 cases in the community, 28 confirmed, the remainder unconfirmed. Published NSW data suggests a case doubling time of the order of 3 days, 15 days representing 5 doublings, community cases could be at least of the order of 9600 today, as a figure of 382 confirmed cases is published. Surfking67 (talk) 03:04, 21 March 2020 (UTC)
@Tkh7:@Surfking67: I came to the page to check if the statistics were charting the Doubling Time. --- I should mention that I'm inexperienced with Wikipedia, and am open to lots of guidance. --- So, Doubling Time is a useful interpretation of the Infection numbers. --- An example of it is being reported by Professor Andreas Burkert in University of Munchen, using WHO and Robert Koch Institute information. It includes the Doubling Time for Australia, and significantly our trend line is important to watch. Professor Burkett is posting this chart on his facebook and twitter accounts. e.g. https://www.facebook.com/andreas.burkert.54 His charts included attribution to WHO and Robert Koch Institute. --- Could we find a local source showing Doubling Time (DT)? I have found these two local data sites: https://www.covid19data.com.au/ and https://covid-19-au.github.io/. These have more analysis but not yet including Doubling Time (DT). Ryderesident (talk) 21:27, 21 March 2020 (UTC)
Update QLD stats from 94 to 144
I am not sure how I request to edit the page. But here is a reference for someone to edit.
This edit request to 2020 coronavirus pandemic in Australia has been answered. Set the |answered= or |ans= parameter to no to reactivate your request. |
https://www.abc.net.au/news/2020-03-19/coronavirus-queensland-cases-rise-50-ine-one-day/12070902 — Preceding unsigned comment added by Johnanderson632 (talk • contribs) 06:39, 19 March 2020 (UTC)
 Done @Johnanderson632: It's okay I was able to understand the request no worries! For future reference the simplest approach for edit requests is to click the "View source" tab on any page you want to edit then click "Submit an edit request" which will load the appropriate template on the talk page. Then you just format your request like this: "Please update QLD cumulative stats from 94 to 144" with the source in brackets like [ ] so it displays like [1] <- this. Hope that helps. Alucard 16❯❯❯ chat? 08:34, 19 March 2020 (UTC)
- Currently the page is protected from newly registered accounts and IP address to prevent vandalism and unsourced information. Once your account becomes established you will be able to edit the page. Currently the page is semi-protected. Alucard 16❯❯❯ chat? 08:38, 19 March 2020 (UTC)
Super! Thanks. This page is only page that helps people to see all stats. Hence I guess fast reliable update would be helping many Australians. I wish I can be confirmed soon so I can update without hassling moderators. Johnanderson632 (talk) 09:17, 19 March 2020 (UTC)
New cases for NSW and another death
This edit request has been answered. Set the |answered= or |ans= parameter to no to reactivate your request. |
NSW Health just announced there are 46 new cases which make a total of 353. And an 81-year-old woman died yesterday. [2]
I did wrong again :( I had to click view source and submit an edit request, but just opened a new topic. Next time I will do correctly.
 Already done It's okay no worries mate! Thanks for trying to keep the page up to date :) Looks like everything in this request has already been done. Alucard 16❯❯❯ chat? 07:06, 20 March 2020 (UTC)
I checked the page and I didn't see that error it may have been fixed already. If it hasn't please reopen this request. Alucard 16❯❯❯ chat? 07:07, 20 March 2020 (UTC)-->
Semi-protected edit request on 20 March 2020
This edit request to 2020 coronavirus pandemic in Australia has been answered. Set the |answered= or |ans= parameter to no to reactivate your request. |
Add COVID-19 by Status plot

Laiyiyin (talk) 04:43, 20 March 2020 (UTC)
 Not done Please phrase your request in the form of "change X to Y" and cite your sources. Mgasparin (talk) 19:51, 24 March 2020 (UTC)
Semi-protected edit request on 21 March 2020
This edit request to 2020 coronavirus pandemic in Australia has been answered. Set the |answered= or |ans= parameter to no to reactivate your request. |
Victoria just announced new 51 cases and now total is 229 https://7news.com.au/lifestyle/health-wellbeing/victoria-sees-massive-jump-in-number-of-coronavirus-cases--c-755765 Johnanderson632 (talk) 00:20, 21 March 2020 (UTC)
 Already done Mgasparin (talk) 19:52, 24 March 2020 (UTC)
Timeline of deaths per day graph vs new cases per day graph.
Not sure if it's better to have the deaths per day graph start at the first of March with the first death as it is in the article or as it is below starting at the date of the first case to make it more comparable by time to the new cases by day graph.
For example, on China's page these two graphs are very comparable by time. https://en.wikipedia.org/wiki/2019%E2%80%9320_coronavirus_pandemic_in_mainland_China#Statistics
- HelperAnt
| Graphs are unavailable due to technical issues. There is more info on Phabricator and on MediaWiki.org. |
- This graph will soon become unmanageable when displaying daily. It may have to be changed to weekly and eventually, monthly. In the interim, the days leading up to the first death may need to be removed. Clifton9 (talk) 12:24, 25 March 2020 (UTC)
Problem with tracking case numbers
Hi guys I have a problem with the total that you have at end-of-day, and also trying to reconcile that total across several sites. I believe that the Worldometer site is using dynamic counters that are estimating cases, and then they adjust the case number to actual at some interval I have not determined. I have seen them go backwards (being a nite owl watching this data).
I decided that the John Hopkins medical dashboard was authoritative because they are using the WHO situation reports. I have been plotting data from sites for a few days now and it is driving me bananas. Where are you getting your data, and why is it different to the AU case reports? Why are Bing and worldometer larger than WHO? Why are your numbers seeming in advance of the case reports that you reference? This needs to be resolved, its very difficult to plot the Growth Factor and determine Doubling intervals when data is unreconcillable making it questionable or dare I say looking predictive? Please discuss your sources and techniques. — Preceding unsigned comment added by Raef.senior (talk • contribs) 13:16, 21 March 2020 (UTC)
- The data used here comes from the state and territory daily bulletins. No doubt it is ahead of WHO counts.--Grahame (talk) 02:54, 22 March 2020 (UTC)
Impact for WA
No one is gonna lists the impacts it has on WA? NakhlaMan (talk) 09:02, 22 March 2020 (UTC)
@NakhlaMan: If you want to try and bring some impacts for Western Australia, you can help out as I reckon their would be some major events in the state that has been affected. HawkAussie (talk) 05:01, 24 March 2020 (UTC)
March: Overly Detailed
Hi Contributors. I was considering placing the Template:Overly detailed on the March 2020 sections but thought I'd bring the conversation here first. There is absolutely no need for the level of detail in those sections which basically list out each case as it was reported. As you can see, by the time you get to week 3 this becomes impossible and hence the level of prior detail becomes irrelevant and I believe needs to be significantly summarised. When you look back at this as a historical event it is definitely more reading than necessary in my opinion. Glancing at a few of the pages for other countries I don't see them being so comprehensive. Thoughts of others? Clifton9 (talk) 11:12, 22 March 2020 (UTC)
I agree with the sentiment, though could they be buried under another layer of headings (eg by day)? I don’t know, but it is becoming a wall of text Iamthinking2202 (talk) 07:26, 23 March 2020 (UTC)
Update info with ABC live blog
'Reliable' government source: https://www.abc.net.au/news/2020-03-22/coronavirus-australia-live-updates-covid-19-latest-news-lockdown/12078506
Can someone update and fact-check everything (especially in the timelines, i saw some spelling mistakes and assumed the author was in a rush)?
JMonkey2006 (talk) 11:43, 22 March 2020 (UTC)
Australia federal/commonwealth government shut down
I'm starting a discussion given the risk of further disputes. I don't understand most of this edit [3] as I explained in my reversion [4]. Firstly, the bit I do understand is that the federal government's decision to allow restaurants, cafes, bottleshops, schools etc to remain open doesn't affect the state government's decisions to close these and therefore if we are going to mention this, we need to make this clearer. So I left that part out of my second edits.
However, I don't understand what User:Ashton 29 means about the rest of it. Unless I've missed it through multiple read through, there's no mention of the Australian federal government ordered closures in the lead. I'm aware the article proper does discuss the federal government's shut down, if you look at my first edits, that's where I copied the section from. [5] [6] It's also why I didn't provide refs since strictly speaking refs are rarely required for the lead since the lead should be duplicating what's in the article proper. (I appreciate that with an article as active as this, some may prefer refs for the lead so have no objection if people want to duplicate them.)
Anyway I'm a Kiwi so maybe there's something I don't understand. The main reason I'm here is because I'd earlier read about NSW and Victoria and happened to see the federal government shutdown on the BBC at first thinking it was referring to the NSW/Victoria actions then realising it was actually from the federal government and it seemed a big development so was surprised to visit this article and find no mention of it in the lead.
As I understand it, the federal government's actions are going to affect all of Australia. (Well I'm not sure about Christmas Island and stuff like that.) While I appreciate NSW and Victoria are already doing similar stuff, and going further than that, as said in my edit summary, it seems fairly weird even considering the population being centred in those 2 states to fail to mention what is going on in the rest of Australia in the lead when it's something as significant as this. (Queensland does have nearly 5 million or ~18% of the population after all.)
I mean we already mention the border closures of the other states. Is there some reason why the federal governments actions to shutdown places of social gathering should only be mentioned in the article but not in the lead? We also already mention the requirement for 4 square metre distancing as well which frankly seems less significant than the complete closure of places of social gathering. Is there something else that I've missed and the sources haven't made clear? Are the federal government ordered shutdowns only advisory and it's up to the other states to implement them or something?
Nil Einne (talk) 15:49, 22 March 2020 (UTC)
Semilog graph option enabled for the states graph
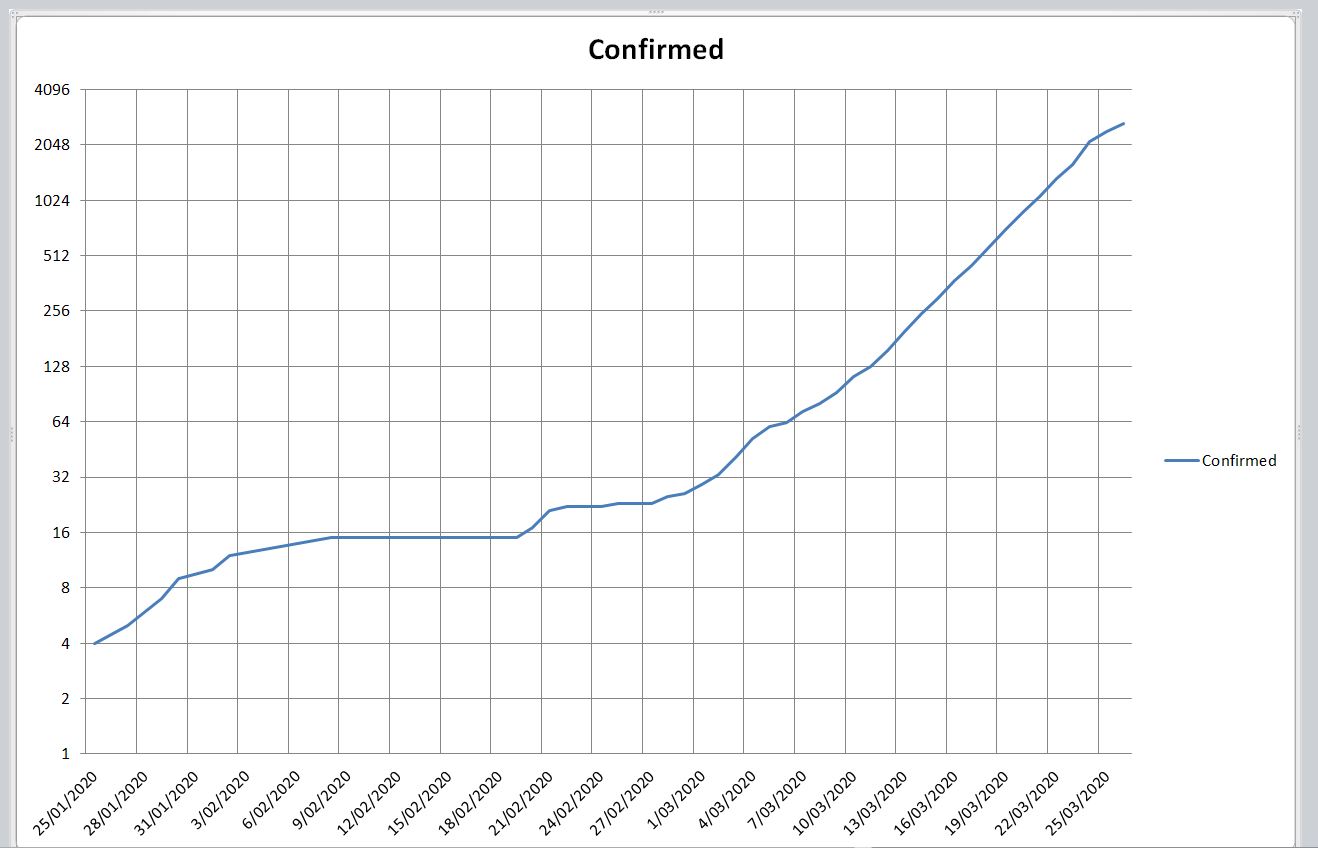
Just as the top of this article has semilog plots for world-scale data, we now have a semilog plot for the per-state data in Oz. I put 1.2^(days) as a round number guide for the eye. Comment: Unsurprisingly, without the extreme lockdowns like in China and Europe (especially PL, CZ, SK), the exponentials will continue unchanged for many weeks. 1.2^13 is just over 10. So "business as usual" or "business just slightly unusual" will mean about 13k lab-confirmed infections by 23+13=36 March, aka 5 April, nationally, with 6000 cases in NSW (and 60 deaths in NSW, if the roughly 1% crude fatality rate in Oz continues). This is slower than most of the EU rates, many of which are around +30% to +40%/day. Maybe because of the lower population density. Or the warm weather. Boud (talk) 00:36, 23 March 2020 (UTC)
- Comment: In case it's not obvious, this also means that without serious lockdowns like in China and the EU (especially PL, CZ, SK around 12 March), another month of 1.2^d would give about 60,000 SARS-CoV-2 cases in NSW by 18 April 2020, with 600 COVID-19 deaths; or 130,000 SARS-CoV-2 cases in Australia, with about 1,300 or so COVID-19 deaths. The semilog graph shows clearly that there is no sign of any weakening of the exponential growth in NSW for three weeks. (I heard a rumour of a "tipping point" - which is nonsense in the light of this data; the tipping point - sustained local transmission giving exponential growth - was passed in NSW three weeks ago, and in several states about two weeks ago. Just look at the graph.) For any of this elementary interpretation to go in the article, external sources would be needed, of course. Boud (talk) 01:42, 23 March 2020 (UTC)
- Comment: The cumulative totals [7] do not "look right" and misrepresent the data to a naive viewer. The graph renderer seems to be rounding points to the nearest line division, which quantises away detail resulting in "flat sections" of the graph. A naive viewer may also not realise what a semi-log graph means in terms of actual growth. The growth graph is also still a "linear" graph. An important property of an exponential curve is that its derivate (rate of change) exhibits the same shape as the original curve, and this would be best shown when both the cumulative totals and growth graphs were shown on a linear graph. — Preceding unsigned comment added by 193.114.96.60 (talk) 02:55, 23 March 2020 (UTC)
- Linear plots misrepresent the data on exponential growth#Biology to a viewer who wants encyclopedic information. This is an encyclopedia about a topic of (for at least the past three weeks in NSW, and for the past two weeks in much of the rest of Australia) the exponential growth of a virus. There is quantisation, because the official data count people as integers, which is quite reasonable. I've added links in the titles and captions to help readers learn.
The growth graph is also still a "linear" graph.
I'm not sure what the argument is here: probably you're trying to say that log(1.2^d) plotted against d is a straight line, because log(1.2^d) = d log(1.2). True. That's why an epidemic, with exponential growth, is most usefully shown with a semilog plot. It's true that a linear graph can help show the reader that d/dt(e^t) = e^t, at the most recent stages, but then most of the early growth phases are missing. The states/territories graph gives the +20%/day line (1.2^d) to encourage the reader to think about what the graph means in simple terms - this has been done in other similar graphs. - The fact that the SARS-CoV-2 epidemic has been exponential for three weeks in NSW (and two weeks in several other populous states) is invisible if the graph is linear; it is clearly visible in the semilog version. It's not the role of Wikipedia to support misinformation - the rumour that the SARS-CoV-2 epidemic in Australia only just started its local transmission, exponentially growing phase. It's true that some people will not understand semilog graphs, despite being given help to do so, but there are also people who have difficulty understanding graphs at all. These graphs do have the powers of 10 written out early primary school style, rather than with indices (1, 10, 10^2, 10^3, 10^4, ...), aiming at the less mathematically advanced reader. Boud (talk) 16:25, 23 March 2020 (UTC)
- Linear plots misrepresent the data on exponential growth#Biology to a viewer who wants encyclopedic information. This is an encyclopedia about a topic of (for at least the past three weeks in NSW, and for the past two weeks in much of the rest of Australia) the exponential growth of a virus. There is quantisation, because the official data count people as integers, which is quite reasonable. I've added links in the titles and captions to help readers learn.
Solution: return an original graph seen with those on the Coronavirus pandemic pages of other countries (eg: United Kingdom) that demonstrate the curve, and continue to have the logarithmic graph for those who prefer to see case data in that format. The best of both worlds for different viewers with different preferences! Macraesam17 (talk) 01:48, 26 March 2020 (UTC)
Also to my previous comment on having both forms of graphs^ include both for the states, and the national totals for Australia. Macraesam17 (talk) 01:50, 26 March 2020 (UTC)
- Do you mean to have a button to click, like for sortability? So that the user can choose which s/he wants? I think that that would be an excellent idea. That would require someone who knows lua/html well enough to propose a change in the de:Modul:Graph and get it tested properly before making it "live". I'm not sure which page is the natural page for attracting geeky attention and discussing this. Possible pages include: Module_talk:Chart, Template talk:Graph:Chart or Module_talk:Graph.
- A temporary alternative would be to include two copies, one with |yScaleType = log and one without. But then editors would have to update the data for both graphs each time. It's doable, but not the neatest solution. Another option would be to find one of the navboxes to enclose the graph - like Template:Side box - that has an option to make the graph hidden by default, like for some tables, with an obvious button "Show" (and "Hide" to toggle back). That way, one option could be chosen to be unhidden by default, and the other to be hidden by default. Boud (talk) 14:46, 26 March 2020 (UTC)
Semi-protected edit request on 23 March 2020
This edit request to 2020 coronavirus pandemic in Australia has been answered. Set the |answered= or |ans= parameter to no to reactivate your request. |
Notice the total cases to date chart has been changed from a linear scale to a logarithmic scale. Personally I preferred the Linear scale as it was easier to predict as the whether the graph was approaching an inflection point ready to curve over.
Just my personal observation but thought I'd put forward the suggestion.
Phil. 203.129.24.45 (talk) 03:21, 23 March 2020 (UTC)
- I don't see how you can interpret that with a cumulative linear graph. On the semilog graph of either the cumulative or new cases data, when the slope weakens (no longer a straight line in the graph) you know that the second derivative of the cumulative case count has become negative: that's the first sign that lockdown type measures are having an effect. This is visible in some of the East/SE Asian and EU countries' data. The new cases graph will show a maximum of new cases/day on the same day, no matter whether the graph is linear or semilog. Boud (talk) 16:41, 23 March 2020 (UTC)
Official statistics have more recent numbers
I checked "Coronavirus (COVID-19) current situation and case numbers"[8], which is official statistics by the government. Although each state website is not updated as the federal health department. What is the best way to update the cumulative total cases table in this case? should I just update all numbers and leave cite on total? — Preceding unsigned comment added by Johnanderson632 (talk • contribs) 06:27, 23 March 2020 (UTC)
Semi-protected edit request on 24 March 2020
This edit request to 2020 coronavirus pandemic in Australia has been answered. Set the |answered= or |ans= parameter to no to reactivate your request. |
Wanted to be able to edit this page, because some of the formatting is about out, namely the graph at the bottom of the page whch goes into the notes sections, it looks bad. Rorzay (talk) 02:45, 24 March 2020 (UTC)
![]() Done Answer: I think it's fixed now. I added | position = left
HelperAnt (talk)HelperAnt
Done Answer: I think it's fixed now. I added | position = left
HelperAnt (talk)HelperAnt
NSW count for 24 March
Hi, the number of cases you have included for NSW in your tables for 24 March is not consistent with the previous numbers in the series. The number of cases shown for NSW are the number of cases at 8pm on the previous evening (so for example, the 23 March figure is actually the number at 8pm on 22 March). The number you have shown on 24 March is the number at 3pm on 24 March, not the number at 8pm of the previous night. The "correct" number should be 818. This is important as politicians/the press are talking about a 116 increase in cases (which looks like improved numbers from the previous day), whereas the actual increase should be 211. Thanks, Karen Cutter 119.18.2.66 (talk) 22:31, 24 March 2020 (UTC)
Recoveries
It is clear that the relevant state authorities are not maintaining the data on 'recovered' cases and in all likelihood it is not possible for it ever to be accurate. Therefore, if it is not accurate then there really is no point in publishing it on this page and I suggest that it needs to be removed. I think it is reasonable to consider that this data is dubious and it's removal requires discussion.Clifton9 (talk) 07:36, 25 March 2020 (UTC)
- Recovered numbers are remarkably similar to cases for 14 days earlier, which is what you would expect. It suggests that over time recoveries are reported.--Grahame (talk) 01:59, 26 March 2020 (UTC)
- Thanks Grahame, good observation. Will continue to monitor it and re-visit the topic if it doesn't appear to be keeping up. Clifton9 (talk) 02:23, 26 March 2020 (UTC)
- NSW finally disclosed how many patients are receiving active treatment, it should be safe to assume the others have recovered. They only officially reported the original 4 patients from China.
- Thanks Grahame, good observation. Will continue to monitor it and re-visit the topic if it doesn't appear to be keeping up. Clifton9 (talk) 02:23, 26 March 2020 (UTC)
https://www.health.nsw.gov.au/news/Pages/20200327_00.aspx
Liam Skoda (talk) 04:13, 27 March 2020 (UTC)
External territories
The article states "No cases have been reported in [...] the external territories of Christmas Island, the Cocos (Keeling) Islands and Norfolk Island." What about Australian Antarctic Territory and Coral Sea Islands? Ypna (talk) 02:29, 26 March 2020 (UTC)
Semi-protected edit request on 26 March 2020
 | It is requested that an edit be made to the semi-protected redirect at 2020 coronavirus pandemic in Australia. (edit · history · last · links · protection log)
This template must be followed by a complete and specific description of the request, that is, specify what text should be removed and a verbatim copy of the text that should replace it. "Please change X" is not acceptable and will be rejected; the request must be of the form "please change X to Y".
The edit may be made by any autoconfirmed user. Remember to change the |
Still looking at the graph which has changed from a linear to logarithmic scale. I do see the merit of both.
I also have had a quick read of https://en.wikipedia.org/wiki/Semi-log_plot & noticed https://en.wikipedia.org/wiki/File:Influenza-2009-cases-logarithmic.png
Replicated the chart in Excel & got this with a Base2 Y-Axis.... but can't upload that image without setting up an account, but have saved the image here.... http://weather.inverellit.com/images/casesbase2.jpg
Just food for thought. Not sure what is most appropriate.
Cheers. 203.129.24.45 (talk) 03:00, 26 March 2020 (UTC)
Here are some graphs the other way if others want to include both. HelperAnt (talk)HelperAnt
| Graphs are unavailable due to technical issues. There is more info on Phabricator and on MediaWiki.org. |
Also if others want to include boths ways for the states:
| Graphs are unavailable due to technical issues. There is more info on Phabricator and on MediaWiki.org. |
Semi-protected edit request on 26 March 2020
| It is requested that an edit be made to the semi-protected redirect at 2020 coronavirus pandemic in Australia. (edit · history · last · links · protection log)
This template must be followed by a complete and specific description of the request, that is, specify what text should be removed and a verbatim copy of the text that should replace it. "Please change X" is not acceptable and will be rejected; the request must be of the form "please change X to Y".
The edit may be made by any autoconfirmed user. Remember to change the |
please update the information with the latest reference on the page for the 26th.
You have provided new data for the 26th however the page information has not been changed to reflect these new data figures. 1.152.106.35 (talk) 03:07, 26 March 2020 (UTC)
Semi-protected edit request on 26 March 2020 - update Death Count
| It is requested that an edit be made to the semi-protected redirect at 2020 coronavirus pandemic in Australia. (edit · history · last · links · protection log)
This template must be followed by a complete and specific description of the request, that is, specify what text should be removed and a verbatim copy of the text that should replace it. "Please change X" is not acceptable and will be rejected; the request must be of the form "please change X to Y".
The edit may be made by any autoconfirmed user. Remember to change the |
UPDATE DEATH COUNT, so CHANGE Genyobne (talk) 03:15, 26 March 2020 (UTC)
Semi-protected edit request on 26 March 2020
| It is requested that an edit be made to the semi-protected redirect at 2020 coronavirus pandemic in Australia. (edit · history · last · links · protection log)
This template must be followed by a complete and specific description of the request, that is, specify what text should be removed and a verbatim copy of the text that should replace it. "Please change X" is not acceptable and will be rejected; the request must be of the form "please change X to Y".
The edit may be made by any autoconfirmed user. Remember to change the |
Change Genyobne (talk) 03:36, 26 March 2020 (UTC)
There is 7 cases in Melton, Victoria
There is 7 cases in Melton Region in Victoria. — Preceding unsigned comment added by 112.213.209.200 (talk) 08:35, 26 March 2020 (UTC)
Update on total number of cases in Tasmania 26 March 2020
5 new cases, brings tally to 47 [3] Susietran (talk) 10:01, 26 March 2020 (UTC)
cases jump
pls add additional information about Australia case has been increasing due to the ships, where people disembarked. — Preceding unsigned comment added by 194.193.223.146 (talk) 00:35, 27 March 2020 (UTC)
new cases ACT 27.3.20
[4] 9 new cases, total now 62Susietran (talk) 02:47, 27 March 2020 (UTC)
- ^ "More COVID-19 cases confirmed in Victoria". Victorian Department of Health & Human Services. 2020-03-12. Retrieved 2020-03-12.
{{cite web}}: CS1 maint: url-status (link) - ^ https://www.health.gov.au/news/health-alerts/novel-coronavirus-2019-ncov-health-alert#travellers-and-visitors
- ^ https://www.dhhs.tas.gov.au/news/2020/coronavirus_update_-_26_march_2020
- ^ https://www.theguardian.com/australia-news/live/2020/mar/27/coronavirus-news-australia-update-live-stage-2-3-lockdown-nsw-victoria-qld-scott-morrison-restrictions-cases-death-toll-covid-19-latest-updates
- C-Class Australia articles
- High-importance Australia articles
- WikiProject Australia articles
- C-Class COVID-19 articles
- Mid-importance COVID-19 articles
- WikiProject COVID-19 articles
- C-Class Disaster management articles
- Mid-importance Disaster management articles
- C-Class medicine articles
- Low-importance medicine articles
- C-Class pulmonology articles
- Unknown-importance pulmonology articles
- Pulmonology task force articles
- All WikiProject Medicine pages
- C-Class virus articles
- Low-importance virus articles
- WikiProject Viruses articles
- Wikipedia articles that use Australian English
- Wikipedia semi-protected edit requests
- Wikipedia edit requests possibly using incorrect templates