Division of Macarthur
| Macarthur Australian House of Representatives Division | |
|---|---|
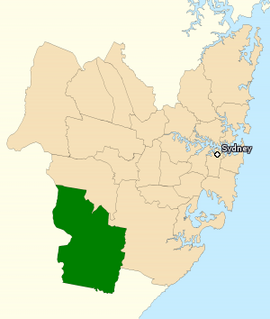
 Division of Macarthur in New South Wales, as of the 2016 federal election | |
| Created | 1949 |
| MP | Mike Freelander |
| Party | Labor |
| Namesake | John Macarthur and Elizabeth Macarthur |
| Electors | 133,501 (2022) |
| Area | 363 km2 (140.2 sq mi) |
| Demographic | Outer metropolitan |
The Division of Macarthur is an Australian electoral division in the state of New South Wales.
History
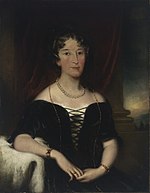
The division is named after John Macarthur and his wife Elizabeth, who were both pioneers of Australia's wool industry. The main products and work in the electorate are in the fruit and vegetable production, lucerne and fodder crops, wine, dairy cattle and horse-breeding.
Macarthur has changed hands regularly over the years as redistributions have favoured different parties. Macarthur was a bellwether seat from the time of its establishment in 1949 until the 2007 election—during that 58-year period it was always held by a member of the governing party or coalition. Originally a hybrid urban-rural seat stretching from southwest Sydney to the Southern Highlands, successive redistributions have shrunk the geographical size of the seat due to the rapid growth of the Campbelltown area. In the redistribution prior to the 2001 federal election, Southern Highlands towns such as Bowral and Moss Vale were removed, shrinking the seat to one eighth of its original size and making it an entirely Sydney-based seat. This made the seat notionally Labor by 1.3%, from the previous 5.6% of the Liberals, prompting Liberal minister and former New South Wales premier John Fahey to retire. However, his replacement as Liberal candidate, former ultra-marathoner, Pat Farmer, achieved an 8.3% swing to retain the seat for the Liberals, actually tallying a primary vote large enough to win without the need for preferences. He increased the margin from 7 to 9.5% at the 2004 election.[1][2]
Ahead of the 2007 election, a redistribution seemingly consolidated Farmer's hold on the seat; the Liberal majority was boosted to 11.1%. However, Farmer was nearly defeated in the election, suffering a swing of 10.4%. The swing was spread evenly across the electorate, reflecting its solid mortgage belt character. The swing was particularly large in the heavily mortgaged suburbs of Narellan, Camden and the traditionally more Labor-voting areas of Campbelltown. Farmer's margin was reduced to an extremely marginal 0.7%. A further redistribution in 2010 made it notionally a Labor seat. Farmer was defeated for Liberal preselection by Campbelltown mayor Russell Matheson, who was able to retain the seat for the Liberals. Matheson gained a large swing at the 2013 election, increasing the Liberal margin to 11.1 percent. The Liberal margin was reduced to just 3.3 percent in the redistribution prior to the 2016 election,[1][2] and additionally, a ReachTEL poll of 628 voters conducted in Macarthur during the election campaign saw Labor leading the Liberals.[3] At the 2016 election Labor challenger Mike Freelander took the seat off the Liberals on a swing of just under 12 percent, ending the Liberals' twenty-year hold on the seat and turning it into a safe Labor seat in one stroke. Freelander actually won enough votes on the first count to defeat Matheson without the need for preferences.
Ahead of the 2016 federal election, ABC psephologist Antony Green listed the seat in his election guide as one of eleven which he classed as bellwether electorates.[4]
Boundaries and demographics
Since 1984, federal electoral division boundaries in Australia have been determined at redistributions by a redistribution committee appointed by the Australian Electoral Commission. Redistributions occur for the boundaries of divisions in a particular state, and they occur every seven years, or sooner if a state's representation entitlement changes or when divisions of a state are malapportioned.[5]
Located in outer south-west Sydney and covering 363 square kilometres (140 sq mi), the present boundaries of the division cover the southern suburbs of Campbelltown and parts of the local government area of Camden. It encompasses the suburbs of Airds, Ambarvale, Blair Athol, Blairmount, Bow Bowing, Bradbury, Campbelltown, Catherine Field, Claymore, Currans Hill, Eagle Vale, Englorie Park, Eschol Park, Gilead, Gledswood Hills, Glen Alpine, Gregory Hills, Kearns, Kentlyn, Leumeah, Menangle Park, Minto, Minto Heights, Oran Park, Raby, Rosemeadow, Ruse, Smeaton Grange, St Andrews, St Helens Park, Varroville, Wedderburn, Woodbine; as well as parts of Bringelly, Denham Court, Harrington Park, Ingleburn, Leppington, Menangle, Mount Annan, Narellan, and Rossmore.
While the electorate is predominantly outer-suburban, its contains some semi-rural areas such as Bringelly and Leppington. The population of the electorate is likely to expand significantly over coming years due to the release of new land surrounding Sydney for residential development.[1][2]
It is a mortgage belt area, with a high percentage of young families, leading to the proportion of residents under 18 being 35%, compared to the national average of 27.2%, with a low proportion of senior citizens (5.9% compared to 12.1%). This is further highlighted in the fact that 23.3% of the population is attending school, compared to the national average of 18.1%. The income is above average, with 19.7% of the families in the electorate earning less than A$500 per week, compared to 24.3% for the national average. The birth demographics of the electorate are similar to the rest of Australia, with the proportion of people born overseas and in non-English speaking countries within one percentage point of the national average.[1][2]
Members
Election results
| Party | Candidate | Votes | % | ±% | |
|---|---|---|---|---|---|
| Labor | Mike Freelander | 51,001 | 45.89 | −1.89 | |
| Liberal | Binod Paudel | 33,867 | 30.48 | −0.37 | |
| One Nation | Adam Zahra | 8,876 | 7.99 | −0.61 | |
| Greens | Jayden Rivera | 8,584 | 7.72 | +3.30 | |
| United Australia | Rosa Sicari | 6,602 | 5.94 | +3.42 | |
| Liberal Democrats | Scott Korman | 2,197 | 1.98 | +1.98 | |
| Total formal votes | 111,127 | 92.78 | +1.63 | ||
| Informal votes | 8,646 | 7.22 | −1.63 | ||
| Turnout | 119,773 | 89.78 | −1.88 | ||
| Two-party-preferred result | |||||
| Labor | Mike Freelander | 65,039 | 58.53 | +0.13 | |
| Liberal | Binod Paudel | 46,088 | 41.47 | −0.13 | |
| Labor hold | Swing | +0.13 | |||
References
- ^ a b c d Macarthur - 2016 federal election guide: Antony Green ABC
- ^ a b c d Macarthur guide: AEC
- ^ "19 May 2016 Macarthur poll: ReachTEL 20 May 2016". Archived from the original on 20 September 2016. Retrieved 20 May 2016.
- ^ The Bellwether Contests: Antony Green ABC
- ^ Muller, Damon (14 November 2017). "The process of federal redistributions: a quick guide". Parliament of Australia. Retrieved 19 April 2022.
- ^ Macarthur, NSW, 2022 Tally Room, Australian Electoral Commission.


