
Geography of New York City

The geography of New York City is characterized by its coastal position at the meeting of the Hudson River and the Atlantic Ocean in a naturally sheltered harbor. The city's geography, with its scarce availability of land, is a contributing factor in making New York City the most densely populated city in the United States. Environmental issues are chiefly concerned with managing this density, which also explains why New York is among the most energy efficient and least automobile-dependent cities in the United States. The city's climate is temperate.
Geography

New York City is located on the coast of the Northeastern United States at the mouth of the Hudson River in south eastern New York state. The New York Harbor, with its deep waters and sheltered bays, helped the city grow in significance as a trading city. Much of New York is built on the three islands of Manhattan, Staten Island, and western Long Island, making land scarce and encouraging a high population density.
The Hudson River flows from the Hudson Valley into New York Bay, becoming a tidal estuary that separates the city from the Long Island Sound and separates the Bronx and Manhattan from Long Island. The Harlem River, another tidal strait between the East and Hudson Rivers, separates Manhattan from the Bronx.
The boroughs of New York City straddle the border between two geologic provinces of eastern North America. Brooklyn and Queens, located on Long Island, are part of the eastern coastal plain. Long Island is a massive moraine which formed at the southern fringe of the Laurentide Ice Sheet during the last Ice Age. The Bronx and Manhattan lie on the eastern edge of the Newark Basin, a block of the Earth's crust which sank downward during the disintegration of the supercontinent Pangaea during the Triassic period. The Palisades Sill on the New Jersey shore of the Hudson River exposes ancient, once-molten rock that filled the basin. Tough metamorphic rocks underlie much of Manhattan, providing solid support for its many skyscrapers.
The city's land has been altered considerably by human intervention, with substantial land reclamation along the waterfronts since Dutch colonial times. Reclamation is most notable in Lower Manhattan with modern developments like Battery Park City. Much of the natural variations in topography have been evened out, particularly in Manhattan.[1]
The city's land area is estimated to be 321 mi² (831.4 km²).[2] However, a more recent estimate calculates a total land area of 304.8 sq mi (789.4 km²)[3] The highest natural point in the city is Todt Hill on Staten Island, which at 409.8 ft (124.9 m) above sea level is the highest hill on the Eastern Seaboard south of Maine. The summit of the ridge is largely covered in woodlands as part of the Staten Island Greenbelt.
Boroughs

New York City comprises five boroughs, an unusual
Climate
| New York | ||||||||||||||||||||||||||||||||||||||||||||||||||||||||||||
|---|---|---|---|---|---|---|---|---|---|---|---|---|---|---|---|---|---|---|---|---|---|---|---|---|---|---|---|---|---|---|---|---|---|---|---|---|---|---|---|---|---|---|---|---|---|---|---|---|---|---|---|---|---|---|---|---|---|---|---|---|
| Climate chart (explanation) | ||||||||||||||||||||||||||||||||||||||||||||||||||||||||||||
| ||||||||||||||||||||||||||||||||||||||||||||||||||||||||||||
| ||||||||||||||||||||||||||||||||||||||||||||||||||||||||||||


Although it is not in the subtropics and its winters are cold, New York has a humid subtropical climate according to the Köppen climate classification because the coldest month's average temperatures are not low enough for persistent snow cover, at 29.5 °F (−1.4 °C) at JFK and 32.1 °F (0.1 °C) in Central Park. The region's climate is vastly affected by its proximity to the Atlantic Ocean. New York City's climate patterns are affected by the Atlantic Multidecadal Oscillation, a 70-year-long warming and cooling cycle in the Atlantic that influences the frequency and severity of hurricanes and coastal storms.[4]
- Winters are typically cold. Temperatures below 0 °F (−18 °C) only occur about several times per decade on average, but temperatures of 10–20 °F (−12.2 – −6.7 °C) are common at the height of typical winters, especially during cold nights. New York winters sometimes feature snowstorms that can paralyze the city with over a foot of snow. However, variation in the climate also occasionally renders winter mild and almost snowless (such as in 1997-98).
- Springs are mild, averaging in the 50s °F (10 to 15 °C) in late March to the lower 80s °F (26-28 °C) in early June. The weather is unpredictable and can even bring relatively cool summers (such as in 1992) as an occasional surprise, and snowstorms arriving as late as the second week in April (significant snow after mid-March is fairly rare though). Thunderstorms are common in spring.
- Summers in New York are hot and humid, with temperatures commonly exceeding 90 °F (32 °C), although high temperatures above 100 °F (38 °C) are about as rare as subzero (F) lows in winter. Humidity levels are usually quite high in July and August. Thunderstorms are common in summer, although severe weather is more common west of the city in New Jersey because the city's proximity to the ocean usually kills severe thunderstorms before they hit the city. Hurricanes are considered to be a major threat to the area (and especially the Long Island suburbs). While relatively infrequent compared to areas south and east, a direct hit could cause large loss of life and enormous property damage due to the high population in coastal areas.
- Autumns are comfortable in New York and similar to spring in temperature. However, the weather is notably unpredictable and travelers are advised to check forecasts and bring several layers of clothing in late fall and in the early spring months (e.g., November, March, April) as temperatures do fluctuate quickly at these times of year.
- Precipitation is plentiful and averages at 49.7 in (1,262 mm) annually, with spring being the wettest season and February the driest month. Snow averages at 28.1 in (71.4 cm)
- Temperature records have been set as high as 106 °F (41 °C) on July 9, 1936 (in Central Park; LaGuardia Airport recorded a 107 °F (42 °C) temperature on July 3, 1966) and as low as -15 °F (-26 °C) on February 9, 1934. These temperatures are not common and have not been matched or surpassed in more than seven decades. Most recently, temperatures have hit 100 degrees as recently as July 2005 and 103 degrees in August 2006 (both at LaGuardia Airport; Central Park last recorded a temperature at or over 100 °F in August 2001), and dropped to 1 °F as recently as January 2004 (Central Park is cooler than the rest of Manhattan and the boroughs to its south). New York can have excessive days of rain or long stretches of dry weather.
| Month | Jan | Feb | Mar | Apr | May | Jun | Jul | Aug | Sep | Oct | Nov | Dec | Year |
|---|---|---|---|---|---|---|---|---|---|---|---|---|---|
| Record high °F (°C) | 72 (22) |
78 (26) |
86 (30) |
96 (36) |
99 (37) |
101 (38) |
106 (41) |
104 (40) |
102 (39) |
94 (34) |
84 (29) |
75 (24) |
106 (41) |
| Mean maximum °F (°C) | 60.4 (15.8) |
60.7 (15.9) |
70.3 (21.3) |
82.9 (28.3) |
88.5 (31.4) |
92.1 (33.4) |
95.7 (35.4) |
93.4 (34.1) |
89.0 (31.7) |
79.7 (26.5) |
70.7 (21.5) |
62.9 (17.2) |
97.0 (36.1) |
| Mean daily maximum °F (°C) | 39.5 (4.2) |
42.2 (5.7) |
49.9 (9.9) |
61.8 (16.6) |
71.4 (21.9) |
79.7 (26.5) |
84.9 (29.4) |
83.3 (28.5) |
76.2 (24.6) |
64.5 (18.1) |
54.0 (12.2) |
44.3 (6.8) |
62.6 (17.0) |
| Daily mean °F (°C) | 33.7 (0.9) |
35.9 (2.2) |
42.8 (6.0) |
53.7 (12.1) |
63.2 (17.3) |
72.0 (22.2) |
77.5 (25.3) |
76.1 (24.5) |
69.2 (20.7) |
57.9 (14.4) |
48.0 (8.9) |
39.1 (3.9) |
55.8 (13.2) |
| Mean daily minimum °F (°C) | 27.9 (−2.3) |
29.5 (−1.4) |
35.8 (2.1) |
45.5 (7.5) |
55.0 (12.8) |
64.4 (18.0) |
70.1 (21.2) |
68.9 (20.5) |
62.3 (16.8) |
51.4 (10.8) |
42.0 (5.6) |
33.8 (1.0) |
48.9 (9.4) |
| Mean minimum °F (°C) | 9.8 (−12.3) |
12.7 (−10.7) |
19.7 (−6.8) |
32.8 (0.4) |
43.9 (6.6) |
52.7 (11.5) |
61.8 (16.6) |
60.3 (15.7) |
50.2 (10.1) |
38.4 (3.6) |
27.7 (−2.4) |
18.0 (−7.8) |
7.7 (−13.5) |
| Record low °F (°C) | −6 (−21) |
−15 (−26) |
3 (−16) |
12 (−11) |
32 (0) |
44 (7) |
52 (11) |
50 (10) |
39 (4) |
28 (−2) |
5 (−15) |
−13 (−25) |
−15 (−26) |
| Average precipitation inches (mm) | 3.64 (92) |
3.19 (81) |
4.29 (109) |
4.09 (104) |
3.96 (101) |
4.54 (115) |
4.60 (117) |
4.56 (116) |
4.31 (109) |
4.38 (111) |
3.58 (91) |
4.38 (111) |
49.52 (1,258) |
| Average snowfall inches (cm) | 8.8 (22) |
10.1 (26) |
5.0 (13) |
0.4 (1.0) |
0.0 (0.0) |
0.0 (0.0) |
0.0 (0.0) |
0.0 (0.0) |
0.0 (0.0) |
0.1 (0.25) |
0.5 (1.3) |
4.9 (12) |
29.8 (76) |
| Average extreme snow depth inches (cm) | 5.8 (15) |
7.9 (20) |
4.4 (11) |
0.4 (1.0) |
0.0 (0.0) |
0.0 (0.0) |
0.0 (0.0) |
0.0 (0.0) |
0.0 (0.0) |
0.0 (0.0) |
0.4 (1.0) |
3.7 (9.4) |
12.3 (31) |
| Average precipitation days (≥ 0.01 in) | 10.8 | 10.0 | 11.1 | 11.4 | 11.5 | 11.2 | 10.5 | 10.0 | 8.8 | 9.5 | 9.2 | 11.4 | 125.4 |
| Average snowy days (≥ 0.1 in) | 3.7 | 3.2 | 2.0 | 0.2 | 0.0 | 0.0 | 0.0 | 0.0 | 0.0 | 0.0 | 0.2 | 2.1 | 11.4 |
| Average relative humidity (%) | 61.5 | 60.2 | 58.5 | 55.3 | 62.7 | 65.2 | 64.2 | 66.0 | 67.8 | 65.6 | 64.6 | 64.1 | 63.0 |
| Average dew point °F (°C) | 18.0 (−7.8) |
19.0 (−7.2) |
25.9 (−3.4) |
34.0 (1.1) |
47.3 (8.5) |
57.4 (14.1) |
61.9 (16.6) |
62.1 (16.7) |
55.6 (13.1) |
44.1 (6.7) |
34.0 (1.1) |
24.6 (−4.1) |
40.3 (4.6) |
| Mean monthly sunshine hours | 162.7 | 163.1 | 212.5 | 225.6 | 256.6 | 257.3 | 268.2 | 268.2 | 219.3 | 211.2 | 151.0 | 139.0 | 2,534.7 |
| Percent possible sunshine | 54 | 55 | 57 | 57 | 57 | 57 | 59 | 63 | 59 | 61 | 51 | 48 | 57 |
| Average ultraviolet index | 2 | 3 | 4 | 6 | 7 | 8 | 8 | 8 | 6 | 4 | 2 | 1 | 5 |
| Source 1: NOAA (relative humidity and sun 1961–1990; dew point 1965–1984)[6][7][8] | |||||||||||||
| Source 2: Weather Atlas[9]. | |||||||||||||
| Month | Jan | Feb | Mar | Apr | May | Jun | Jul | Aug | Sep | Oct | Nov | Dec | Year |
|---|---|---|---|---|---|---|---|---|---|---|---|---|---|
| Average sea temperature °F (°C) |
41.7 (5.4) |
39.7 (4.3) |
40.2 (4.5) |
45.1 (7.3) |
52.5 (11.4) |
64.5 (18.1) |
72.1 (22.3) |
74.1 (23.4) |
70.1 (21.2) |
63.0 (17.2) |
54.3 (12.4) |
47.2 (8.4) |
55.4 (13.0) |
Environmental Issues

New York City plays an important role in the green policy agenda because of its size. Environmental groups make large efforts to help shape legislation in New York because they see the strategy as an efficient way to influence national programs. New York City's economy is larger than Switzerland's, a size that means the city has potential to set new defacto standards. Manufacturers are also attuned to the latest trends and needs in the city because the market is simply too big to ignore.
Although cities like San Francisco or Portland, Oregon are most commonly associated with urban environmentalism in the United States, New York City's unique urban footprint and extensive transportation systems make it more sustainable than most American cities.
Maps and satellite images
-
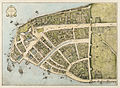 New Amsterdam in 1660
 -
 New York City area in 1906
 -
 New York City in 1910
 -
 False-color satellite image
 -
 Thermal image (blue is warm, yellow is hot)
 -
 Vegetation is beige (sparse) and deep green (dense)
 -
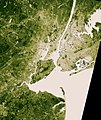
 Satellite photograph of southern Manhattan taken in 2002


See also
References
- ^ Lopate, Phillip (2004). Waterfront: A Walk Around Manhattan. Anchor Press. ISBN 0385497148.
- ^ "Land Use Facts". New York City Department of City Planning. Retrieved 2007-03-13.
- ^ "It's Still a Big City, Just Not Quite So Big". The New York Times. Retrieved 2008-05-22.
- ^ Riley, Mary Elizabeth (2006), Assessing the Impact of Interannual Climate Variability on New York City's Reservoir System ([dead link] – Scholar search), Cornell University Graduate School for Atmospheric Science, retrieved 2007-03-27
{{citation}}: External link in|format= - ^ Belvedere Castle at NYC Parks
- ^ "NowData – NOAA Online Weather Data". National Oceanic and Atmospheric Administration. Retrieved May 4, 2021.
- ^ "Summary of Monthly Normals 1991–2020". National Oceanic and Atmospheric Administration. Archived from the original on May 4, 2021. Retrieved May 4, 2021.
- ^ "New York Central Park, NY Climate Normals 1961−1990". National Oceanic and Atmospheric Administration. Retrieved July 18, 2020.
- ^ a b "New York, New York, USA - Monthly weather forecast and Climate data". Weather Atlas. Retrieved July 4, 2019.
Further reading
- The Vegan Guide to New York City, by Rynn Berry and Chris A. Suzuki
- The Big Green Apple: Your Guide to Eco-Friendly Living in New York City, by Mathieu Fontaine
External links
- Green Apple Map - Interactive green map of New York City's environmental resources.
- NYC Open Accessible Space Information System - Interactive mapping resource of open space in New York City.
- Council on the Environment of New York City (CENYC) - Privately funded citizens' organization in the Office of the Mayor of New York City.
- NYCityMap - New York City Government interactive map
| By topic | ||
|---|---|---|
| Boroughs |
| |
| Government | ||
| Emergency services | ||
| Transportation | ||
| Culture | ||
| Education | ||
| History | ||
Cite error: There are <ref group=lower-alpha> tags or {{efn}} templates on this page, but the references will not show without a {{reflist|group=lower-alpha}} template or {{notelist}} template (see the help page).