From Wikipedia, the free encyclopedia
| This article needs to be updated. Please help update this article to reflect recent events or newly available information. (March 2017) |
This is a list of biggest airlines of Russia, by number of passengers and by the amount of cargo transported.
Passengers Transferred
 Aeroflot Boeing 777-300ER in SkyTeam livery taking off.
 Transaero Boeing 777-300 landing at Vladivostok International Airport.
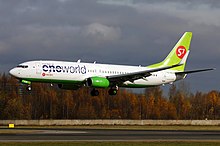
 S7 Airlines Boeing 737-800 in Oneworld livery landing at Domodedovo International Airport.
2016 Statistics
Source: FAVT[1]
2014 Statistics
| The Rossaviation Statistics for Jan-Feb 2014[2]
|
| № |
Airline |
Passenger value |
Growth, % |
Distance, p.km |
Growth, %
|
| 1
|
Aeroflot4 |
23,610,036 |
 13,0 13,0 |
67,121,707 |
 11,4 11,4
|
| 2
|
Transaero |
13,198,591 |
 5,6 5,6 |
47,066,421 |
 0,1 0,1
|
| 3
|
UTair5 |
8,564,340 |
 4,7 4,7 |
20,198,948 |
 20,4 20,4
|
| 4
|
S7 Airlines6 |
7,938,199 |
 12,0 12,0 |
15,582,789 |
 9,8 9,8
|
| 5
|
Rossiya |
5,191,783 |
 13,1 13,1 |
10,147,404 |
 10,5 10,5
|
| 6
|
Ural Airlines |
5,160,588 |
 16,8 16,8 |
13,327,154 |
 13,2 13,2
|
| 7
|
Nordwind Airlines |
4,472,038 |
 22,3 22,3 |
13,401,739 |
 1,2 1,2
|
| 8
|
Orenair |
3,034,659 |
 1,6 1,6 |
8,471,008 |
 22.9 22.9
|
| 9
|
Globus |
2,127,931 |
 1,2 1,2 |
5,559,313 |
 3,6 3,6
|
| 10
|
Donavia |
1,736,153 |
 28,3 28,3 |
2,447,994 |
 22,3 22,3
|
| 11
|
VIM Airlines |
1,613,970 |
 16,0 16,0 |
3,389,297 |
 10,2 10,2
|
| 12
|
Yamal Airlines |
1,450,355 |
 11,5 11,5 |
2,899,723 |
 13,6 13,6
|
| 13
|
Metrojet |
1,344,174 |
 13,2 13,2 |
4,043,292 |
 18,8 18,8
|
| 14
|
Pegas Fly |
1,236,596 |
 by 4.4 by 4.4 |
6,059,896 |
 by 4.8 by 4.8
|
| 15
|
NordStar |
1,104,938 |
 11,1 11,1 |
2,868,556 |
 14,6 14,6
|
2013 Statistics
| The Rossaviation Statistics for Jan-Feb 2013[3]
|
| № |
Airline |
Passenger value |
Growth, % |
Distance, p.km |
Growth, %
|
| 1
|
Aeroflot1 |
20,902,447 |
 18,4 18,4 |
60,226,342 |
 19,2 19,2
|
| 2
|
Transaero |
12,499,985 |
 21,0 21,0 |
47,018,186 |
 14,7 14,7
|
| 3
|
UTair2 |
8,182,074 |
 5,3 5,3 |
16,769,794 |
 10,6 10,6
|
| 4
|
S7 Airlines3 |
7,084,599 |
 11,6 11,6 |
14,197,750 |
 9,0 9,0
|
| 5
|
Rossiya |
4,590,146 |
 9,1 9,1 |
9,186,257 |
 4,9 4,9
|
| 6
|
Ural Airlines |
4,419,233 |
 25,4 25,4 |
11,768,176 |
 23,2 23,2
|
| 7
|
Nordwind Airlines |
3,655,688 |
 68,7 68,7 |
13,433,472 |
 60,8 60,8
|
| 8
|
Orenair |
3,140,950 |
 1,6 1,6 |
10,983,780 |
 4,6 4,6
|
| 9
|
Globus |
2,154,312 |
 10,9 10,9 |
5,366,394 |
 16,7 16,7
|
| 10
|
VIM Airlines |
1,391,020 |
 8,0 8,0 |
3,075,973 |
 11,4 11,4
|
| 11
|
Donavia |
1,353,574 |
 37,3 37,3 |
2,001,135 |
 39,6 39,6
|
| 12
|
Yamal Airlines |
1,301,242 |
 42,5 42,5 |
2,553,011 |
 48,6 48,6
|
| 13
|
NordStar |
1,243,360 |
 7,1 7,1 |
3,358,092 |
 11,4 11,4
|
| 14
|
Metrojet |
1,187,785 |
 61,9 61,9 |
3,403,399 |
 72,9 72,9
|
| 15
|
Yakutia Airlines |
1,098,909 |
 4,1 4,1 |
3,286,344 |
 8,4 8,4
|
2012 statistics
| The Rossaviation Statistics for Jan-Feb 2012[4]
|
| № |
Airline |
Passenger value |
Growth, % |
Distance, p.km |
Growth, %
|
| 1
|
Aeroflot1 |
17,656,152 |
 24,6 24,6 |
50 532 518 |
 20,3 20,3
|
| 2
|
Transaero |
10,327,560 |
 22,2 22,2 |
41 003 887 |
 23,6 23,6
|
| 3
|
UTair2 |
7,769,881 |
 33,9 33,9 |
15 166 155 |
 36,4 36,4
|
| 4
|
S7 Airlines3 |
6,351,010 |
 23,8 23,8 |
13 025 241 |
 23,5 23,5
|
| 5
|
Rossyia |
4,208,906 |
 19,0 19,0 |
8 761 024 |
 21,8 21,8
|
| 6
|
Ural Airlines |
3,525,066 |
 40,3 40,3 |
9 548 267 |
 39,7 39,7
|
| 7
|
Orenair |
3,193,474 |
 27,4 27,4 |
10 505 213 |
 40,1 40,1
|
| 8
|
Nordwind Airlines |
2,167,267 |
 25,9 25,9 |
8 353 261 |
 14,7 14,7
|
| 9
|
Globus |
1,942,782 |
 32,0 32,0 |
4 596 794 |
 34,1 34,1
|
| 10
|
VIM Airlines |
1,511,682 |
 6,3 6,3 |
3 472 582 |
 12,3 12,3
|
| 11
|
Vladivostok Air |
1,162,174 |
 4,3 4,3 |
3 134 214 |
 30,9 30,9
|
| 12
|
Nordstar Airlines |
1,161,101 |
 50,5 50,5 |
3 015 574 |
 35,3 35,3
|
| 13
|
Yakutia Airlines |
1,145,630 |
 12,4 12,4 |
3 586 342 |
 6,3 6,3
|
| 14
|
Donavia |
985,682 |
 14,1 14,1 |
1 433 658 |
 12,8 12,8
|
| 15
|
Kuban Airlines |
955,896 |
 6,2 6,2 |
1 764 292 |
 28,8 28,8
|
- Notes
- ^4 Excluding the Aeroflot-Group Airlines Rossyia, Donavia, Aurora, Orenair и Pobeda
- ^5 Excluding UTair-Group Airlines UTair Express and other airlines
- ^6 Excluding an S7-Group Airline Globus
- The airlines mentioned with cursive letters, are the airlines, which ceased their operations currently
By Cargo Transportation
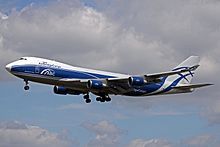
 Boeing 747-400 AirBridgeCargo
2014 Statistics
| Rossaviation statistics Dec-Jan 2012-2013[2]
|
| № |
Airline |
Cargo Transported, тонн |
Growth, % |
Distance, t.km |
Growth, %
|
| 1
|
AirBridgeCargo |
516,525 |
 21,1 21,1 |
3,247,631 |
 18,2 18,2
|
| 2
|
Aeroflot |
145,285 |
 17,7 17,7 |
681,699 |
 25,9 25,9
|
| 3
|
Transaero |
69,333 |
 0,6 0,6 |
383,902 |
 2,3 2,3
|
| 4
|
Volga-Dnepr Airlines |
40,656 |
 24,5 24,5 |
220,516 |
 17,7 17,7
|
| 5
|
S7 Airlines |
36,667 |
 0,4 0,4 |
81,095 |
 0,3 0,3
|
| 6
|
UTair |
24,711 |
 16,0 16,0 |
47,948 |
 20,0 20,0
|
| 7
|
Abakan-Avia |
14,629 |
— |
20,105 |
—
|
| 8
|
224th fleet |
14,400 |
 6,8 6,8 |
45,872 |
 4,2 4,2
|
| 9
|
Ural Airlines |
14,346 |
 2.7 2.7 |
42,745 |
 1,8 1,8
|
| 10
|
Aviastar-TU |
12,966 |
 5,5 5,5 |
35,378 |
 13,9 13,9
|
| 11
|
ATRAN |
12,259 |
 166,0 166,0 |
17,644 |
 126,9 126,9
|
| 12
|
Globus |
12,043 |
 7,8 7,8 |
36,762 |
 4,5 4,5
|
| 13
|
Alrosa |
11,182 |
 10,2 10,2 |
28,336 |
 7,2 7,2
|
| 14
|
Yakutia Airlines |
10,554 |
 14,2 14,2 |
51,231 |
 17,7 17,7
|
| 15
|
Rossiya |
9,580 |
 6,0 6,0 |
20,881 |
 1,5 1,5
|
2013 Statistics
| Rossaviation statistics Dec-Jan 2012-2013[3]
|
| № |
Airline |
Cargo Transported, тонн |
Growth, % |
Distance, t.km |
Growth, %
|
| 1
|
AirBridgeCargo |
426,442 |
 20,9 20,9 |
2,746,976 |
 15,5 15,5
|
| 2
|
Aeroflot |
176,456 |
 9,0 9,0 |
919,521 |
 18,0 18,0
|
| 3
|
Transaero |
69,735 |
 5,9 5,9 |
392,993 |
 3,0 3,0
|
| 4
|
Volga-Dnepr Airlines |
53,835 |
 19,0 19,0 |
268,125 |
 23,7 23,7
|
| 5
|
S7 Airlines |
36,515 |
 2,4 2,4 |
80,862 |
 4,6 4,6
|
| 6
|
UTair |
29,412 |
 3,2 3,2 |
59,962 |
 3,9 3,9
|
| 7
|
224 fleet |
15,453 |
 7,3 7,3 |
47,873 |
 5,7 5,7
|
| 8
|
Ural Airlines |
14,744 |
 9,5 9,5 |
43,533 |
 2,2 2,2
|
| 9
|
Globus |
13,063 |
 6,2 6,2 |
38,479 |
 3,3 3,3
|
| 10
|
Alrosa |
12,458 |
 13,7 13,7 |
30,532 |
 20,6 20,6
|
| 11
|
Yakutia Airlines |
12,298 |
 21,5 21,5 |
62,219 |
 8,7 8,7
|
| 12
|
Aviastar-TU |
12,284 |
 6,7 6,7 |
31,072 |
 7,6 7,6
|
| 13
|
Polet Airlines |
10,576 |
 51,0 51,0 |
50,056 |
 53,8 53,8
|
| 14
|
Rossiya |
10,192 |
 3,2 3,2 |
21,208 |
 2,8 2,8
|
| 15
|
Vladivostok Air |
7,991 |
 9,0 9,0 |
21,146 |
 28,8 28,8
|
By the fleet capacity and destinations
The Russia's biggest airlines by the number of the fleet and destinations:
- Notes
See also
References


