Xiji County
Xiji
西吉县 ثِڭِ ثِيًا | |
|---|---|
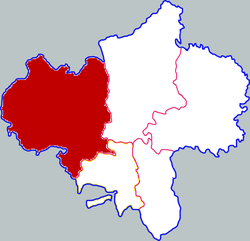
 Xiji in Guyuan | |
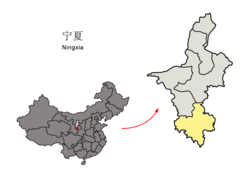
 Guyuan in Ningxia | |
| Coordinates: 35°58′06″N 105°43′02″E / 35.96833°N 105.7173°E | |
| Country | People's Republic of China |
| Autonomous region | Ningxia |
| Prefecture-level city | Guyuan |
| Area | |
| • Total | 3,129.4 km2 (1,208.3 sq mi) |
| Population | |
| • Total | 354,321 |
| • Density | 110/km2 (290/sq mi) |
| Time zone | UTC+8 (China Standard) |
Xiji County (simplified Chinese: 西吉县; traditional Chinese: 西吉縣; pinyin: Xījí Xiàn, Xiao'erjing=ثِڭِ ثِيًا) is a county under the administration of the prefecture-level city of Guyuan in the southwest of the Ningxia Hui Autonomous Region of the People's Republic of China, bordering Gansu province to the west. It has a total area of 3,985 km2 (1,539 sq mi), and a population of 480,800 people, including 263,000 Hui people.
Characteristics
Xiji County is an agricultural county, and its main product are wheat, pea, potatoes, buckwheat, vegetables. Common vegetables grown include cabbage, Chinese cabbage, celery, tomatoes, chili peppers, cucumbers, garlic, and melons. The county government is located in the town of Jiqiang, and the district's postal code is 756200.
Administrative divisions
Xiji County has 3 towns and 7 townships.
- 3 towns
- 7 townships
- Wangmin (王民乡, وَانْمٍ ثِيَانْ)
- Xitan (西滩乡, ثِتًا ثِيَانْ)
- Xingping (兴平乡, ثٍْپِئٍ ثِيَانْ)
- Zhenhu (震湖乡, جٍخُ ثِيَانْ)
- Majian (马建乡, مَاڭِيًا ثِيَانْ)
- Tianping (田坪乡, تِيًاپِئٍ ثِيَانْ)
- Hongyao (红耀乡, خوْیَوْ ثِيَانْ)
Climate
| Climate data for Xiji (1991–2020 normals, extremes 1981–2010) | |||||||||||||
|---|---|---|---|---|---|---|---|---|---|---|---|---|---|
| Month | Jan | Feb | Mar | Apr | May | Jun | Jul | Aug | Sep | Oct | Nov | Dec | Year |
| Record high °C (°F) | 10.1 (50.2) |
16.3 (61.3) |
23.7 (74.7) |
28.1 (82.6) |
29.7 (85.5) |
31.2 (88.2) |
33.4 (92.1) |
31.9 (89.4) |
30.5 (86.9) |
23.2 (73.8) |
17.3 (63.1) |
10.5 (50.9) |
33.4 (92.1) |
| Mean daily maximum °C (°F) | −0.1 (31.8) |
3.3 (37.9) |
9.1 (48.4) |
15.7 (60.3) |
20.0 (68.0) |
23.6 (74.5) |
25.1 (77.2) |
23.8 (74.8) |
18.8 (65.8) |
13.1 (55.6) |
7.0 (44.6) |
1.6 (34.9) |
13.4 (56.2) |
| Daily mean °C (°F) | −8.2 (17.2) |
−4.3 (24.3) |
1.6 (34.9) |
7.9 (46.2) |
12.7 (54.9) |
16.7 (62.1) |
18.7 (65.7) |
17.5 (63.5) |
12.7 (54.9) |
6.5 (43.7) |
−0.3 (31.5) |
−6.5 (20.3) |
6.3 (43.3) |
| Mean daily minimum °C (°F) | −14.2 (6.4) |
−10.0 (14.0) |
−4.0 (24.8) |
1.3 (34.3) |
5.9 (42.6) |
10.3 (50.5) |
13.2 (55.8) |
12.4 (54.3) |
8.1 (46.6) |
1.8 (35.2) |
−5.3 (22.5) |
−12.0 (10.4) |
0.6 (33.1) |
| Record low °C (°F) | −29.0 (−20.2) |
−26.2 (−15.2) |
−19.1 (−2.4) |
−9.4 (15.1) |
−6.0 (21.2) |
1.3 (34.3) |
5.3 (41.5) |
2.6 (36.7) |
−2.1 (28.2) |
−13.3 (8.1) |
−18.7 (−1.7) |
−32.0 (−25.6) |
−32.0 (−25.6) |
| Average precipitation mm (inches) | 3.3 (0.13) |
5.0 (0.20) |
9.4 (0.37) |
22.2 (0.87) |
39.9 (1.57) |
59.6 (2.35) |
82.2 (3.24) |
87.3 (3.44) |
54.3 (2.14) |
31.9 (1.26) |
7.9 (0.31) |
1.7 (0.07) |
404.7 (15.95) |
| Average precipitation days (≥ 0.1 mm) | 4.2 | 4.5 | 5.8 | 6.6 | 9.2 | 10.4 | 12.4 | 11.7 | 11.1 | 8.8 | 4.6 | 2.4 | 91.7 |
| Average snowy days | 6.7 | 6.9 | 5.2 | 1.7 | 0.2 | 0 | 0 | 0 | 0 | 1.8 | 4.0 | 4.4 | 30.9 |
| Average relative humidity (%) | 63 | 62 | 57 | 53 | 56 | 62 | 71 | 74 | 76 | 74 | 68 | 64 | 65 |
| Mean monthly sunshine hours | 180.5 | 165.4 | 196.2 | 215.7 | 233.0 | 223.2 | 215.8 | 202.8 | 150.7 | 162.2 | 169.3 | 184.7 | 2,299.5 |
| Percent possible sunshine | 58 | 53 | 52 | 55 | 53 | 51 | 49 | 49 | 41 | 47 | 56 | 61 | 52 |
| Source: China Meteorological Administration[1][2] | |||||||||||||
References
- ^ 中国气象数据网 – WeatherBk Data (in Simplified Chinese). China Meteorological Administration. Retrieved 26 August 2023.
- ^ 中国气象数据网 (in Simplified Chinese). China Meteorological Administration. Retrieved 26 August 2023.
