
2014 London local elections
| |||||||||||||||||||||||||||||||||||||||||||||
All 1,851 councillors on all 32 London boroughs | |||||||||||||||||||||||||||||||||||||||||||||
|---|---|---|---|---|---|---|---|---|---|---|---|---|---|---|---|---|---|---|---|---|---|---|---|---|---|---|---|---|---|---|---|---|---|---|---|---|---|---|---|---|---|---|---|---|---|
| Turnout | 38.9% ( | ||||||||||||||||||||||||||||||||||||||||||||
| |||||||||||||||||||||||||||||||||||||||||||||
 London borough councils by political control following election. Councils that are Labour are in red, Conservative in blue, Liberal Democrat in yellow and two in no overall control party-politically are in black. | |||||||||||||||||||||||||||||||||||||||||||||

.jpg)

There were local government elections in London on Thursday 22 May 2014. All councillor seats on the 32 London borough councils were up for election. The electorates of Hackney, Lewisham, Newham and Tower Hamlets also elected their executive mayors, who operate in place of council leaders in those boroughs. Ward changes took place in Hackney, Kensington and Chelsea, and Tower Hamlets, which reduced the total number of councillors by 10 to 1,851. Both the mayoral and councillor elections are four-yearly.
The results saw London Labour achieve their best result in over 40 years, winning 1,060 councillors, control of 20 out of 32 councils and 38% of the popular vote (their highest since 1998). Only the elections of 1964, 1971 and 1974 have seen Labour win more than 1,060 council seats in London, and Labour has not controlled 20 councils or more since 1971. This result was subsequently surpassed by the party's performance in the 2018 elections.
The London Conservatives dropped to their lowest-ever percentage of the vote in a London local election, at just 26.4%, and fell to their lowest councillor total since 1998. The London Liberal Democrats' vote halved, with the party dropping to 11% of the popular vote and 116 seats (down 130), the worst result for the Lib Dems or the Liberals since 1978.
The election saw a record vote for parties outside the 3 major parties, with UKIP, the London Green Party, independents and other minor parties winning a collective 25.4% of the vote, the highest since the creation of the London Boroughs in 1964. 63 minor party or independent councillors were elected in total.
UKIP and the Greens saw their best-ever results in terms of vote share (9.8% for the Greens and 9.5% for UKIP), but whilst UKIP gained 12 seats, the Greens gained just 2.
Following the elections, two of the thirty two London borough councils were in no overall control, a decrease of one. All four mayoral elections returned the incumbent mayors: 3 Labour and 1 Tower Hamlets First.
Results summary
| Party[1] | Votes won | % votes | Change | Seats | % seats | Change | Councils | Change | |
|---|---|---|---|---|---|---|---|---|---|
| Labour | 944,967 | 37.6 | 1,060 | 57.3 | 20 | ||||
| Conservative | 663,847 | 26.4 | 612 | 33.1 | 9 | ||||
| Liberal Democrats | 267,769 | 10.6 | 116 | 6.3 | 1 | ||||
| Green | 246,805 | 9.8 | 4 | 0.2 | 0 | ||||
| UKIP | 239,001 | 9.5 | 12 | 0.6 | 0 | ||||
| Others | 152,684 | 6.1 | 47 | 2.5 | 0 | ||||
| No overall control | — | 2 | |||||||
- Turnout: 2,284,882 voters cast ballots, a turnout of 38.9% (−23.1%).[2]
Councils results
| Council | Overall result | Cons. | Lab. | Lib. Dem. | UKIP | Green | Others | Turnout | Council election | |||
|---|---|---|---|---|---|---|---|---|---|---|---|---|
| 2010 | 2014[3] | |||||||||||
| Barking and Dagenham
style="width: 2px; color:inherit; background-color: #E4003B;" data-sort-value="Labour Party (UK)" | |
Labour
style="width: 2px; color:inherit; background-color: #E4003B;" data-sort-value="Labour Party (UK)" | |
Labour | 51 | 38.16% | Details | |||||||
| Barnet
style="width: 2px; color:inherit; background-color: #0087DC;" data-sort-value="Conservative Party (UK)" | |
Conservative
style="width: 2px; color:inherit; background-color: #0087DC;" data-sort-value="Conservative Party (UK)" | |
Conservative | 32 | 30 | 1 | 41.10% | Details | |||||
| Bexley
style="width: 2px; color:inherit; background-color: #0087DC;" data-sort-value="Conservative Party (UK)" | |
Conservative
style="width: 2px; color:inherit; background-color: #0087DC;" data-sort-value="Conservative Party (UK)" | |
Conservative | 45 | 15 | 3 | Details | ||||||
| Brent
style="width: 2px; color:inherit; background-color: #E4003B;" data-sort-value="Labour Party (UK)" | |
Labour
style="width: 2px; color:inherit; background-color: #E4003B;" data-sort-value="Labour Party (UK)" | |
Labour | 6 | 56 | 1 | 33.00% | Details | |||||
| Bromley
style="width: 2px; color:inherit; background-color: #0087DC;" data-sort-value="Conservative Party (UK)" | |
Conservative
style="width: 2px; color:inherit; background-color: #0087DC;" data-sort-value="Conservative Party (UK)" | |
Conservative | 51 | 7 | 2 | Details | ||||||
| Camden
style="width: 2px; color:inherit; background-color: #E4003B;" data-sort-value="Labour Party (UK)" | |
Labour
style="width: 2px; color:inherit; background-color: #E4003B;" data-sort-value="Labour Party (UK)" | |
Labour | 12 | 40 | 1 | 1 | 38.69% | Details | ||||
| Croydon
style="width: 2px; color:inherit; background-color: #0087DC;" data-sort-value="Conservative Party (UK)" | |
Conservative
style="width: 2px; color:inherit; background-color: #E4003B;" data-sort-value="Labour Party (UK)" | |
Labour | 30 | 40 | 38.00% | Details | ||||||
| Ealing
style="width: 2px; color:inherit; background-color: #E4003B;" data-sort-value="Labour Party (UK)" | |
Labour
style="width: 2px; color:inherit; background-color: #E4003B;" data-sort-value="Labour Party (UK)" | |
Labour | 12 | 53 | 4 | 41.30% | Details | |||||
| Enfield
style="width: 2px; color:inherit; background-color: #E4003B;" data-sort-value="Labour Party (UK)" | |
Labour
style="width: 2px; color:inherit; background-color: #E4003B;" data-sort-value="Labour Party (UK)" | |
Labour | 22 | 41 | 37.79% | Details | ||||||
| Greenwich
style="width: 2px; color:inherit; background-color: #E4003B;" data-sort-value="Labour Party (UK)" | |
Labour
style="width: 2px; color:inherit; background-color: #E4003B;" data-sort-value="Labour Party (UK)" | |
Labour | 8 | 43 | 37.25% | Details | ||||||
| Hackney
style="width: 2px; color:inherit; background-color: #E4003B;" data-sort-value="Labour Party (UK)" | |
Labour
style="width: 2px; color:inherit; background-color: #E4003B;" data-sort-value="Labour Party (UK)" | |
Labour | 4 | 50 | 3 | 42.89% | Details | |||||
| Hammersmith and Fulham
style="width: 2px; color:inherit; background-color: #0087DC;" data-sort-value="Conservative Party (UK)" | |
Conservative
style="width: 2px; color:inherit; background-color: #E4003B;" data-sort-value="Labour Party (UK)" | |
Labour | 20 | 26 | 38.00% | Details | ||||||
| Haringey
style="width: 2px; color:inherit; background-color: #E4003B;" data-sort-value="Labour Party (UK)" | |
Labour
style="width: 2px; color:inherit; background-color: #E4003B;" data-sort-value="Labour Party (UK)" | |
Labour | 48 | 9 | 38.10% | Details | ||||||
| Harrow
style="width: 2px; color:inherit; background-color: black;" data-sort-value="No overall control" | |
No overall control
style="width: 2px; color:inherit; background-color: #E4003B;" data-sort-value="Labour Party (UK)" | |
Labour | 26 | 34 | 1 | 2[others 1] | 41.00% | Details | ||||
| Havering
style="width: 2px; color:inherit; background-color: #0087DC;" data-sort-value="Conservative Party (UK)" | |
Conservative
style="width: 2px; color:inherit; background-color: black;" data-sort-value="No overall control" | |
No overall control | 22 | 1 | 7 | 24[others 2] | Details | |||||
| Hillingdon
style="width: 2px; color:inherit; background-color: #0087DC;" data-sort-value="Conservative Party (UK)" | |
Conservative
style="width: 2px; color:inherit; background-color: #0087DC;" data-sort-value="Conservative Party (UK)" | |
Conservative | 42 | 23 | 35.76% | Details | ||||||
| Hounslow
style="width: 2px; color:inherit; background-color: #E4003B;" data-sort-value="Labour Party (UK)" | |
Labour
style="width: 2px; color:inherit; background-color: #E4003B;" data-sort-value="Labour Party (UK)" | |
Labour | 11 | 49 | 36.80% | Details | ||||||
| Islington
style="width: 2px; color:inherit; background-color: #E4003B;" data-sort-value="Labour Party (UK)" | |
Labour
style="width: 2px; color:inherit; background-color: #E4003B;" data-sort-value="Labour Party (UK)" | |
Labour | 47 | 1 | 38.40% | Details | ||||||
| Kensington and Chelsea
style="width: 2px; color:inherit; background-color: #0087DC;" data-sort-value="Conservative Party (UK)" | |
Conservative
style="width: 2px; color:inherit; background-color: #0087DC;" data-sort-value="Conservative Party (UK)" | |
Conservative | 37 | 12 | 1 | Details | ||||||
| Kingston upon Thames
style="width: 2px; color:inherit; background-color: #FAA61A;" data-sort-value="Liberal Democrats (UK)" | |
Liberal Democrats
style="width: 2px; color:inherit; background-color: #0087DC;" data-sort-value="Conservative Party (UK)" | |
Conservative | 28 | 2 | 18 | Details | ||||||
| Lambeth
style="width: 2px; color:inherit; background-color: #E4003B;" data-sort-value="Labour Party (UK)" | |
Labour
style="width: 2px; color:inherit; background-color: #E4003B;" data-sort-value="Labour Party (UK)" | |
Labour | 3 | 59 | 1 | 32.00% | Details | |||||
| Lewisham
style="width: 2px; color:inherit; background-color: #E4003B;" data-sort-value="Labour Party (UK)" | |
Labour
style="width: 2px; color:inherit; background-color: #E4003B;" data-sort-value="Labour Party (UK)" | |
Labour | 53 | 1 | Details | |||||||
| Merton
style="width: 2px; color:inherit; background-color: black;" data-sort-value="No overall control" | |
No overall control
style="width: 2px; color:inherit; background-color: #E4003B;" data-sort-value="Labour Party (UK)" | |
Labour | 20 | 36 | 1 | 3[others 3] | 41.00% | Details | ||||
| Newham
style="width: 2px; color:inherit; background-color: #E4003B;" data-sort-value="Labour Party (UK)" | |
Labour
style="width: 2px; color:inherit; background-color: #E4003B;" data-sort-value="Labour Party (UK)" | |
Labour | 60 | 40.62% | Details | |||||||
| Redbridge
style="width: 2px; color:inherit; background-color: black;" data-sort-value="No overall control" | |
No overall control
style="width: 2px; color:inherit; background-color: #E4003B;" data-sort-value="Labour Party (UK)" | |
Labour | 25 | 35 | 3 | 39.70% | Details | |||||
| Richmond upon Thames
style="width: 2px; color:inherit; background-color: #0087DC;" data-sort-value="Conservative Party (UK)" | |
Conservative
style="width: 2px; color:inherit; background-color: #0087DC;" data-sort-value="Conservative Party (UK)" | |
Conservative | 39 | 15 | 46.30% | Details | ||||||
| Southwark
style="width: 2px; color:inherit; background-color: #E4003B;" data-sort-value="Labour Party (UK)" | |
Labour
style="width: 2px; color:inherit; background-color: #E4003B;" data-sort-value="Labour Party (UK)" | |
Labour | 2 | 48 | 13 | Details | ||||||
| Sutton
style="width: 2px; color:inherit; background-color: #FAA61A;" data-sort-value="Liberal Democrats (UK)" | |
Liberal Democrats
style="width: 2px; color:inherit; background-color: #FAA61A;" data-sort-value="Liberal Democrats (UK)" | |
Liberal Democrats | 9 | 45 | 42.20% | Details | ||||||
| Tower Hamlets
style="width: 2px; color:inherit; background-color: #E4003B;" data-sort-value="Labour Party (UK)" | |
Labour
style="width: 2px; color:inherit; background-color: black;" data-sort-value="No overall control" | |
No overall control | 5 | 22 | 18[others 4] | Details | ||||||
| Waltham Forest
style="width: 2px; color:inherit; background-color: #E4003B;" data-sort-value="Labour Party (UK)" | |
Labour
style="width: 2px; color:inherit; background-color: #E4003B;" data-sort-value="Labour Party (UK)" | |
Labour | 16 | 44 | 59.22% | Details | ||||||
| Wandsworth
style="width: 2px; color:inherit; background-color: #0087DC;" data-sort-value="Conservative Party (UK)" | |
Conservative
style="width: 2px; color:inherit; background-color: #0087DC;" data-sort-value="Conservative Party (UK)" | |
Conservative | 41 | 19 | Details | |||||||
| Westminster
style="width: 2px; color:inherit; background-color: #0087DC;" data-sort-value="Conservative Party (UK)" | |
Conservative
style="width: 2px; color:inherit; background-color: #0087DC;" data-sort-value="Conservative Party (UK)" | |
Conservative | 44 | 16 | 32.35% | Details | ||||||
| Totals | 612 | 1,060 | 116 | 12 | 4 | 47 | ||||||
Others and notes
- ^ Harrow: Independent, 2;
- ^ Havering: Havering Residents Association, 19; Independent Residents, 5;
- ^ Merton: Merton Park Ward Independent Residents, 3;
- ^ Tower Hamlets: Tower Hamlets First, 18;
Overall councillors by party
| Overall councillors by party | |||
|---|---|---|---|
| Party | Seats | Gain/loss | |
| Labour | 1,060 | +185 | |
| Conservative | 612 | −105 | |
| Liberal Democrats | 116 | −130 | |
| Havering Residents Association | 19 | +7 | |
| Tower Hamlets First | 18 | +18 | |
| UKIP | 12 | +12 | |
| Independent Residents | 5 | +1 | |
| Green | 4 | +2 | |
| Merton Park Residents | 3 | 0 | |
| Independent | 2 | +1 | |
Three seats in Barnet (Colindale) and three in Tower Hamlets (Blackwall and Cubitt Town) were vacancies until elections held on 26 June 2014 in Colindale[4] and on 3 July 2014 in Blackwall and Cubitt Town.[5]
Opinion polling
| Date(s) conducted |
Polling organisation/client | Sample size | Lab | Con | Lib Dem | Grn | UKIP | Others | Lead |
|---|---|---|---|---|---|---|---|---|---|
| style="background:Template:Labour Party (UK)/meta/color; width:60px;" class="unsortable" | | style="background:Template:Conservative Party (UK)/meta/color; width:60px;" class="unsortable" | | style="background:Template:Liberal Democrats (UK)/meta/color; width:60px;" class="unsortable" | | style="background:Template:Green Party of England and Wales/meta/color; width:60px;" class="unsortable" | | style="background:Template:UK Independence Party/meta/color; width:60px;" class="unsortable" | | |||||
| 22 May 2014 | 2014 elections | 2,515,073 | 37.6% | 26.4% | 10.6% | 9.8% | 9.5% | 6.1% | 11.2% |
| 6–8 May 2014 | YouGov | 1,422 | 40% | 33% | 11% | 2% | 10% | 4% | 7% |
| 28–29 April 2014 | Survation | 1,001 | 42% | 26% | 14% | 4% | 11% | 3% | 16% |
| 6 May 2010 | 2010 elections | 3,733,289 | 32.5% | 31.7% | 22.4% | 6.6% | 1.1% | 5.7% | 0.8% |
Mayoral results
In four London boroughs the executive function of the council is a directly elected mayor. The mayoral elections take place at the same time as councillor elections in those boroughs.
| Mayoralty | 2010 | 2014 | ||
|---|---|---|---|---|
| Hackney
#E4003B |
Jules Pipe (Labour)
#E4003B |
Jules Pipe (Labour) | ||
| Lewisham
#E4003B |
Sir Steve Bullock (Labour)
#E4003B |
Sir Steve Bullock (Labour) | ||
| Newham
#E4003B |
Robin Wales (Labour)
#E4003B |
Robin Wales (Labour) | ||
| Tower Hamlets
#DCDCDC |
Lutfur Rahman (Independent)
#800020 |
Lutfur Rahman (Tower Hamlets First) | ||
Borough result maps
-
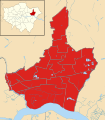 Barking and Dagenham 2014 results map
 -
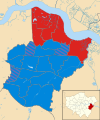
 Barnet 2014 results map
 -
 Bexley 2014 results map
 -
 Brent 2014 results map
 -
 Bromley 2014 results map
 -
 Camden 2014 results map
 -
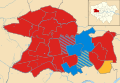
 Croydon 2014 results map
 -
 Ealing 2014 results map
 -
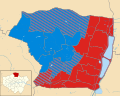 Enfield 2014 results map
 -
 Greenwich 2014 results map
 -
 Hackney 2014 results map
 -
 Hammersmith and Fulham 2014 results map
 -
 Haringey 2014 results map
 -
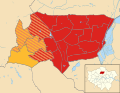
 Harrow 2014 results map
 -
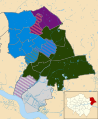 Havering 2014 results map
 -
 Hillingdon 2014 results map
 -
 Hounslow 2014 results map
 -
 Islington 2014 results map
 -
 Kensington and Chelsea 2014 results map
 -
 Kingston upon Thames 2014 results map
 -
 Lambeth 2014 results map
 -
 Lewisham 2014 results map
 -
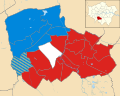 Merton 2014 results map
 -
 Newham 2014 results map
 -
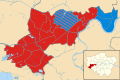
 Redbridge 2014 results map
 -
 Richmond upon Thames 2014 results map
 -
 Southwark 2014 results map
 -
 Sutton 2014 results map
 -
 Tower Hamlets 2014 results map
 -
 Waltham Forest 2014 results map
 -
 Wandsworth 2014 results map
 -
 Westminster 2014 results map
 -
 Greater London 2014 results map


References
- ^ http://www.electionscentre.co.uk/?page_id=3755
- ^ https://files.datapress.com/london/dataset/borough-council-election-results-2014/London-Borough-Council-Elections-2014.pdf
- ^ "2014 borough elections results". London councils. Archived from the original on 22 May 2014. Retrieved 14 May 2014.
- ^ "Archived copy". Archived from the original on 26 May 2014. Retrieved 26 May 2014.
{{cite web}}: CS1 maint: archived copy as title (link) - ^ http://www.eastlondonadvertiser.co.uk/news/labour_and_tories_take_council_seats_in_blackwall_and_cubitt_town_by_election_1_3669435
| General elections |
|
|---|---|
| Local elections |
|
| European elections | |
| Referendums | |
| |