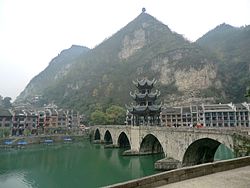
Zhenyuan County, Guizhou
Zhenyuan County
镇远县 Chenyuan; Chenyüan | |
|---|---|
 Zhusheng Bridge (祝圣桥) spanning the Wuyang River | |
| Coordinates (Zhenyuan County government): 27°02′57″N 108°25′47″E / 27.0491°N 108.4297°E | |
| Country | People's Republic of China |
| Province | Guizhou |
| Autonomous prefecture | Qiandongnan |
| Area | |
| • Total | 1,878 km2 (725 sq mi) |
| Population (2010) | |
| • Total | 203,735 |
| • Density | 110/km2 (280/sq mi) |
| Time zone | UTC+8 (China Standard) |
| Zhenyuan County, Guizhou | |||||||||
|---|---|---|---|---|---|---|---|---|---|
 "Tchin-yuen-fou" & 2 other towns of "Koei-tcheou" from Du Halde's 1736 Description of China | |||||||||
| Traditional Chinese | 鎮遠縣 | ||||||||
| Simplified Chinese | 镇远县 | ||||||||
| |||||||||
Zhenyuan County is a county of the Qiandongnan Miao and Dong Autonomous Prefecture in the east of Guizhou province, China.

Climate
| Climate data for Zhenyuan (1981−2010 normals) | |||||||||||||
|---|---|---|---|---|---|---|---|---|---|---|---|---|---|
| Month | Jan | Feb | Mar | Apr | May | Jun | Jul | Aug | Sep | Oct | Nov | Dec | Year |
| Record high °C (°F) | 26.5 (79.7) |
32.6 (90.7) |
35.2 (95.4) |
36.2 (97.2) |
37.5 (99.5) |
36.5 (97.7) |
40.0 (104.0) |
40.1 (104.2) |
39.4 (102.9) |
35.7 (96.3) |
31.6 (88.9) |
25.4 (77.7) |
40.1 (104.2) |
| Mean daily maximum °C (°F) | 8.8 (47.8) |
11.2 (52.2) |
15.6 (60.1) |
22.1 (71.8) |
26.0 (78.8) |
28.8 (83.8) |
31.7 (89.1) |
31.8 (89.2) |
28.1 (82.6) |
21.8 (71.2) |
17.2 (63.0) |
11.9 (53.4) |
21.3 (70.3) |
| Daily mean °C (°F) | 5.3 (41.5) |
7.3 (45.1) |
10.9 (51.6) |
16.6 (61.9) |
20.7 (69.3) |
23.8 (74.8) |
26.0 (78.8) |
25.7 (78.3) |
22.3 (72.1) |
17.2 (63.0) |
12.4 (54.3) |
7.6 (45.7) |
16.3 (61.4) |
| Mean daily minimum °C (°F) | 2.9 (37.2) |
4.7 (40.5) |
7.8 (46.0) |
12.9 (55.2) |
16.9 (62.4) |
20.4 (68.7) |
22.1 (71.8) |
21.6 (70.9) |
18.4 (65.1) |
14.0 (57.2) |
9.1 (48.4) |
4.6 (40.3) |
12.9 (55.3) |
| Record low °C (°F) | −5.3 (22.5) |
−3.8 (25.2) |
−2.7 (27.1) |
3.5 (38.3) |
7.8 (46.0) |
12.2 (54.0) |
14.5 (58.1) |
15.6 (60.1) |
11.0 (51.8) |
4.1 (39.4) |
−1.0 (30.2) |
−4.6 (23.7) |
−5.3 (22.5) |
| Average precipitation mm (inches) | 30.1 (1.19) |
35.6 (1.40) |
59.8 (2.35) |
106.5 (4.19) |
160.2 (6.31) |
177.4 (6.98) |
145.0 (5.71) |
101.9 (4.01) |
83.8 (3.30) |
76.0 (2.99) |
50.0 (1.97) |
25.1 (0.99) |
1,051.4 (41.39) |
| Average relative humidity (%) | 77 | 76 | 77 | 78 | 81 | 82 | 81 | 79 | 78 | 80 | 77 | 75 | 78 |
| Source: China Meteorological Data Service Center | |||||||||||||


