From Wikipedia, the free encyclopedia
The 1964 United States presidential election in Wyoming took place on November 3, 1964, as part of the 1964 United States presidential election. State voters chose three[2] representatives, or electors, to the Electoral College, who voted for president and vice president.
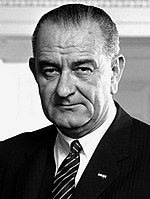
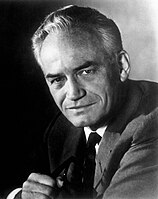
Wyoming was won by incumbent President Lyndon B. Johnson (D–Texas), with 56.56 percent of the popular vote, against Senator Barry Goldwater (R–Arizona), with 43.44% of the popular vote.[3][4] As of the 2016 presidential election[update], this was the last time a Democratic presidential nominee has carried the state of Wyoming – in fact no Democrat has since reached forty percent of the state's vote. It is also the last occasion Laramie County, Fremont County, Sheridan County, Park County, Uinta County, Lincoln County, Goshen County, Big Horn County, Platte County, or Hot Springs County have voted for a Democratic Presidential nominee.[5]
Results
Results by county
| County
|
Lyndon Baines Johnson
Democratic
|
Barry Morris Goldwater
Republican
|
Margin
|
Total votes cast
|
| #
|
%
|
#
|
%
|
#
|
%
|
| Albany
|
6,019
|
67.31%
|
2,923
|
32.69%
|
3,096
|
34.62%
|
8,942
|
| Big Horn
|
2,690
|
50.21%
|
2,668
|
49.79%
|
22
|
0.42%
|
5,358
|
| Campbell
|
1,196
|
42.68%
|
1,606
|
57.32%
|
-410
|
-14.64%
|
2,802
|
| Carbon
|
4,322
|
66.68%
|
2,160
|
33.32%
|
2,162
|
33.36%
|
6,482
|
| Converse
|
1,250
|
44.50%
|
1,559
|
55.50%
|
-309
|
-11.00%
|
2,809
|
| Crook
|
780
|
39.12%
|
1,214
|
60.88%
|
-434
|
-21.76%
|
1,994
|
| Fremont
|
5,985
|
55.45%
|
4,809
|
44.55%
|
1,176
|
10.90%
|
10,794
|
| Goshen
|
2,749
|
51.35%
|
2,604
|
48.65%
|
145
|
2.70%
|
5,353
|
| Hot Springs
|
1,380
|
52.91%
|
1,228
|
47.09%
|
152
|
5.82%
|
2,608
|
| Johnson
|
852
|
34.19%
|
1,640
|
65.81%
|
-788
|
-31.62%
|
2,492
|
| Laramie
|
16,059
|
65.22%
|
8,563
|
34.78%
|
7,496
|
30.44%
|
24,622
|
| Lincoln
|
2,273
|
55.66%
|
1,811
|
44.34%
|
462
|
11.32%
|
4,084
|
| Natrona
|
11,167
|
52.42%
|
10,135
|
47.58%
|
1,032
|
4.84%
|
21,302
|
| Niobrara
|
843
|
42.90%
|
1,122
|
57.10%
|
-279
|
-14.20%
|
1,965
|
| Park
|
3,745
|
50.32%
|
3,698
|
49.68%
|
47
|
0.64%
|
7,443
|
| Platte
|
1,890
|
56.25%
|
1,470
|
43.75%
|
420
|
12.50%
|
3,360
|
| Sheridan
|
4,747
|
51.39%
|
4,491
|
48.61%
|
256
|
2.78%
|
9,238
|
| Sublette
|
791
|
46.78%
|
900
|
53.22%
|
-109
|
-6.44%
|
1,691
|
| Sweetwater
|
5,969
|
75.43%
|
1,944
|
24.57%
|
4,025
|
50.86%
|
7,913
|
| Teton
|
968
|
47.24%
|
1,081
|
52.76%
|
-113
|
-5.52%
|
2,049
|
| Uinta
|
1,929
|
61.93%
|
1,186
|
38.07%
|
743
|
23.86%
|
3,115
|
| Washakie
|
1,695
|
49.74%
|
1,713
|
50.26%
|
-18
|
-0.52%
|
3,408
|
| Weston
|
1,419
|
49.07%
|
1,473
|
50.93%
|
-54
|
-1.86%
|
2,892
|
| Totals |
80,718 |
56.56% |
61,998 |
43.44% |
18,720 |
13.12% |
142,716
|
References


