
Demographics of Luton

Luton, England is an ethnically and culturally diverse large town.
Population
Luton's total population, according to the 2011 UK census, was 203,201. The population density was 4,696 people per square km.
Ethnicity
The following table shows the ethnic group of respondents in the 2001 and 2011 censuses in Luton.
| Ethnic Group | 2001[1] | 2011[2] | ||
|---|---|---|---|---|
| Number | % | Number | % | |
| White: British | 119,793 | 64.97% | 90,530 | 44.55% |
| White: Irish | 8,569 | 4.65% | 6,126 | 3.01% |
| White: Gypsy or Irish Traveller[note 1] | 198 | 0.10% | ||
| White: Other | 4,204 | 2.28% | 14,225 | 7.00% |
| White: Total | 132,566 | 71.90% | 111,079 | 54.66% |
| Asian or Asian British: Indian | 7,538 | 4.09% | 10,625 | 5.23% |
| Asian or Asian British: Pakistani | 17,012 | 9.23% | 29,353 | 14.45% |
| Asian or Asian British: Bangladeshi | 7,641 | 4.14% | 13,606 | 6.70% |
| Asian or Asian British: Chinese[note 2] | 1,096 | 0.59% | 1,497 | 0.74% |
| Asian or Asian British: Other Asian | 1,486 | 0.81% | 5,871 | 2.89% |
| Asian or Asian British: Total | 34,773 | 18.86% | 60,952 | 30.00% |
| Black or Black British: Caribbean | 7,653 | 4.15% | 8,177 | 4.02% |
| Black or Black British: African | 3,204 | 1.74% | 9,169 | 4.51% |
| Black or Black British: Other Black | 827 | 0.45% | 2,563 | 1.26% |
| Black or Black British: Total | 11,684 | 6.34% | 19,909 | 9.80% |
| Mixed: White and Black Caribbean | 2,414 | 1.31% | 3,831 | 1.89% |
| Mixed: White and Black African | 389 | 0.21% | 915 | 0.45% |
| Mixed: White and Asian | 1,058 | 0.57% | 1,805 | 0.89% |
| Mixed: Other Mixed | 867 | 0.47% | 1,730 | 0.85% |
| Mixed: Total | 4,728 | 2.56% | 8,281 | 4.08% |
| Other: Arab[note 3] | 1,646 | 0.81% | ||
| Other: Any other ethnic group | 620 | 0.34% | 1,334 | 0.66% |
| Other: Total | 620 | 0.34% | 2,980 | 1.47% |
| Total | 184,371 | 100.00% | 203,201 | 100.00% |
Notes for table above
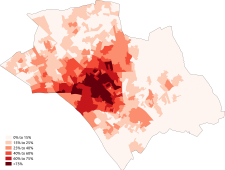
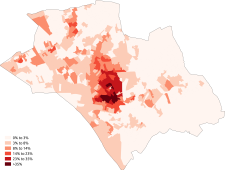
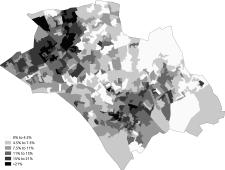
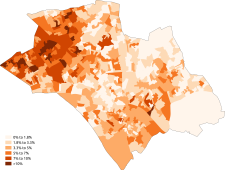
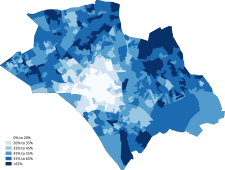
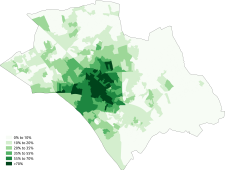
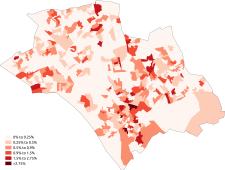
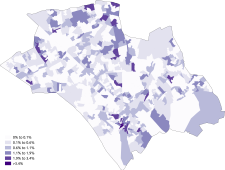
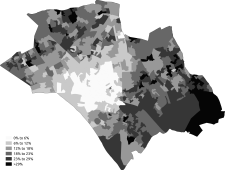
Distribution of ethnic groups in Luton according to the 2011 census.
-
 White
White -
 White-British
 -
 White-Irish
 -
 White-Other
 -
 Asian
Asian -
 Asian-Indian
 -
 Asian-Pakistani
 -
 Asian-Bangladeshi
 -
 Asian-Chinese
 -
 Black
Black -
 Black-African
 -
 Black-Caribbean
 -
 Other-Arab


Languages
The most common main languages spoken in Luton according to the 2011 census are shown below.[3]
| Rank | Language | Usual residents aged 3+ | Proportion |
|---|---|---|---|
| 1 | English | 153,463 | 79.43% |
| 2 | Urdu | 8,567 | 4.43% |
| 3 | Polish | 8,006 | 4.14% |
| 4 | Bengali (with Sylheti and Chatgaya) | 6,337 | 3.28% |
| 5 | Punjabi | 2,203 | 1.14% |
| 6 | Gujarati | 1,714 | 0.89% |
| 7 | Arabic | 1,037 | 0.54% |
| 8 | Lithuanian | 698 | 0.36% |
| 9 | Tamil | 653 | 0.34% |
| 10 | Tagalog/Filipino | 524 | 0.27% |
| 11 | Shona | 489 | 0.25% |
| 12 | Hindi | 484 | 0.25% |
| 13 | French | 439 | 0.23% |
| 14 | Portuguese | 397 | 0.21% |
| 15 | Slovak | 352 | 0.18% |
| 16 | Italian | 342 | 0.18% |
| 17 | Romanian | 340 | 0.18% |
| 18 | Russian | 324 | 0.17% |
| 19 | Malayalam | 316 | 0.16% |
| 20 | Pashto | 293 | 0.15% |
| Other | 6,217 | 3.22% |
Religion
The following table shows the religion of respondents in the 2001 and 2011 censuses in Luton.
| Religion | 2001[4] | 2011[5] | ||
|---|---|---|---|---|
| Number | % | Number | % | |
| Christian | 109,973 | 59.65% | 96,271 | 47.38% |
| Buddhist | 456 | 0.25% | 652 | 0.32% |
| Hindu | 5,025 | 2.73% | 6,749 | 3.32% |
| Jewish | 534 | 0.29% | 326 | 0.16% |
| Muslim | 26,963 | 14.62% | 49,991 | 24.60% |
| Sikh | 1,487 | 0.81% | 2,347 | 1.16% |
| Other religion | 642 | 0.35% | 898 | 0.44% |
| No religion | 25,960 | 14.08% | 33,594 | 16.53% |
| Religion not stated | 13,331 | 7.23% | 12,373 | 6.09% |
| Total | 184,371 | 100.00% | 203,201 | 100.00% |
Distribution of religions in Luton according to the 2011 census.
-
 Christianity
 -
 Islam
Islam -
 Judaism
 -
 Hinduism
 -
 Sikhism
 -
 Buddhism
 -
 Other religion
 -
 No religion


See also
- Demography of the United Kingdom
- Demography of England
- Demography of London
- Demography of Birmingham
- Demography of Greater Manchester
- List of English cities by population
- List of English districts by population
- List of English districts and their ethnic composition
- List of English districts by area
- List of English districts by population density
References
- ^ "2001 census - theme tables". NOMIS. Retrieved 17 June 2015.
- ^ "Download:local authorities: county / unitary". NOMIS. Retrieved 17 June 2015.
- ^ "Download:local authorities: county / unitary". NOMIS. Retrieved 17 June 2015.
- ^ "2001 census - theme tables". Retrieved 17 June 2015.
- ^ "Download:local authorities: county / unitary". NOMIS. Retrieved 17 June 2015.